29
/es/
es
AIzaSyAYiBZKx7MnpbEhh9jyipgxe19OcubqV5w
April 1, 2024
73446
Australia
AUS
true
2
1
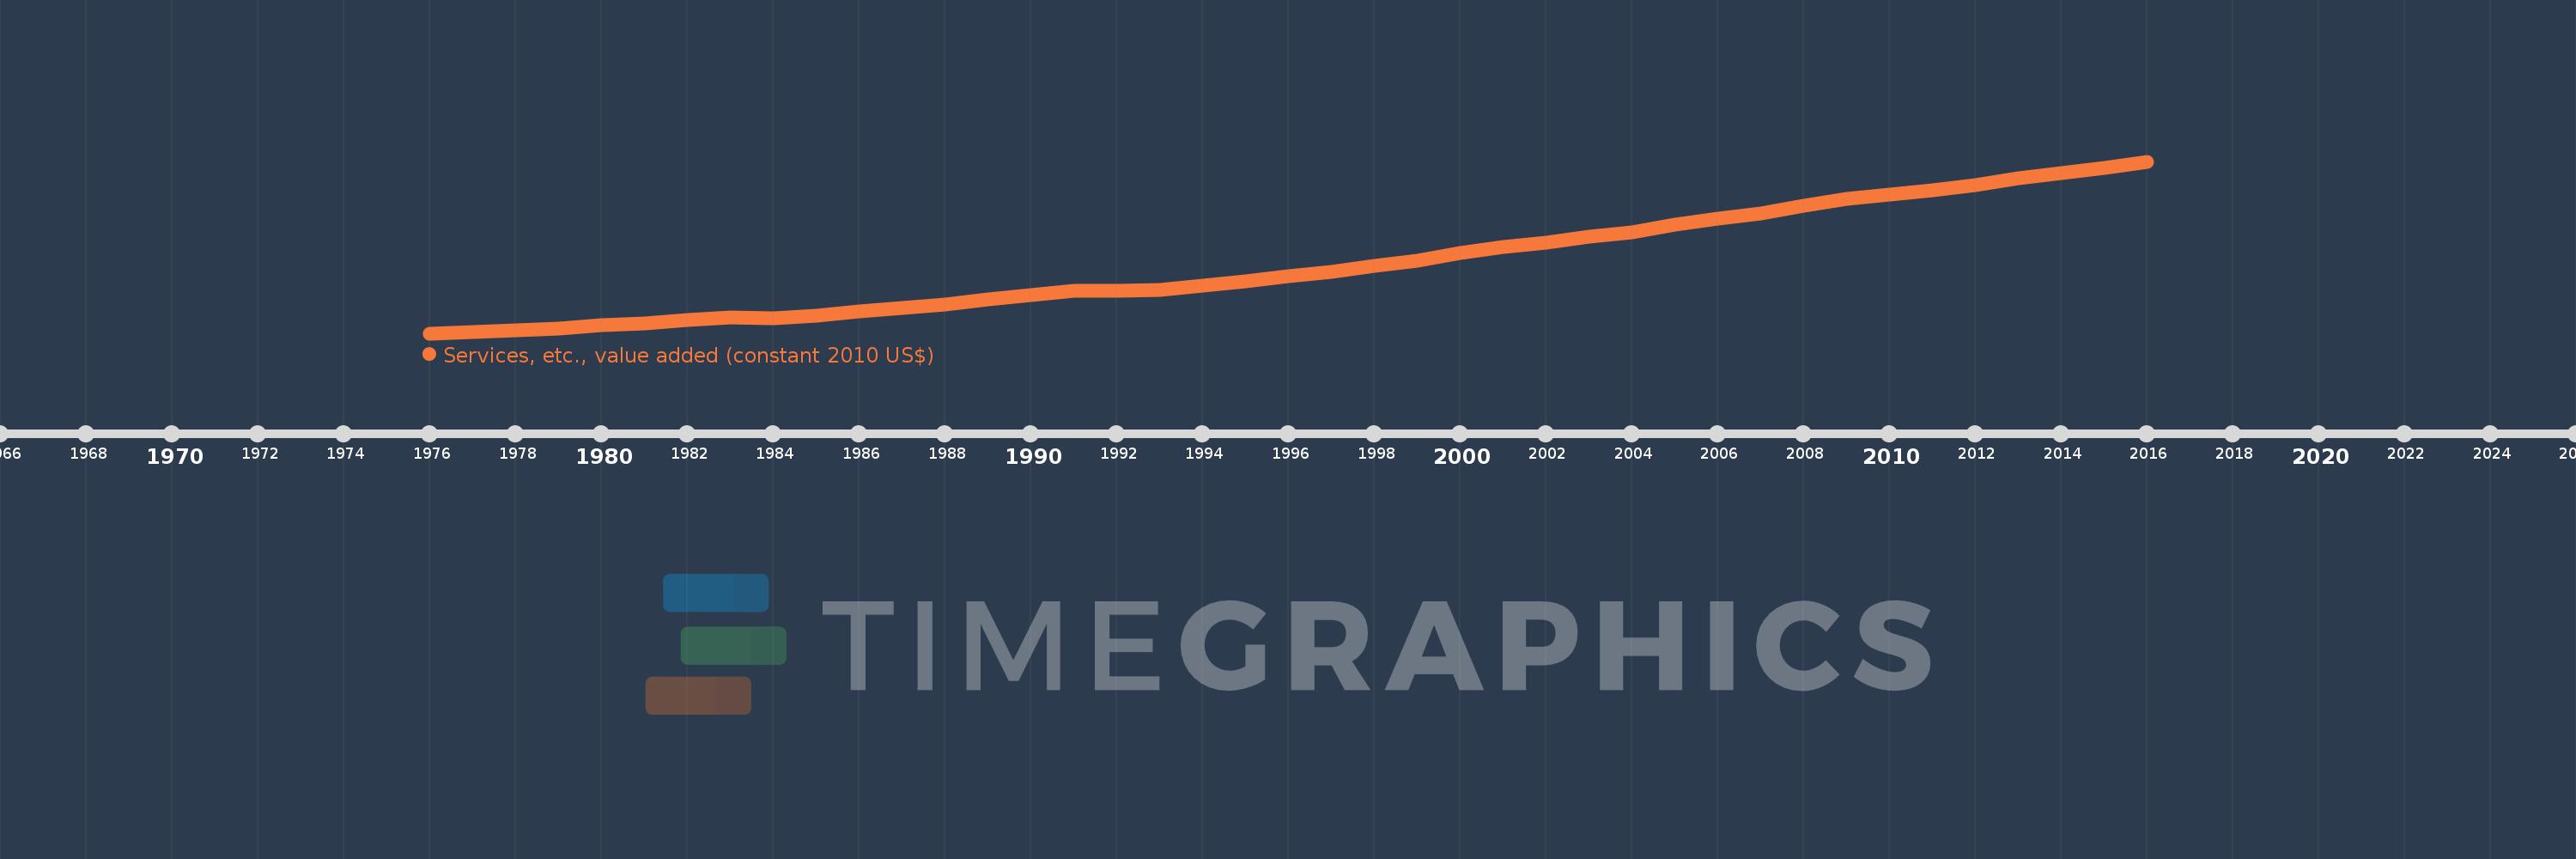
Services, etc., value added (constant 2010 US$)
2016,2015,2014,2013,2012,2011,2010,2009,2008,2007,2006,2005,2004,2003,2002,2001,2000,1999,1998,1997,1996,1995,1994,1993,1992,1991,1990,1989,1988,1987,1986,1985,1984,1983,1982,1981,1980,1979,1978,1977,1976
Estas estadísticas en otros países:
AfghanistanAlbaniaAlgeriaAndorraAntigua and BarbudaArab WorldArgentinaArmeniaArubaAustraliaAustriaAzerbaijanBahamas, TheBahrainBangladeshBarbadosBelarusBelgiumBelizeBeninBermudaBhutanBoliviaBosnia and HerzegovinaBotswanaBrazilBrunei DarussalamBulgariaBurkina FasoBurundiCabo VerdeCambodiaCameroonCanadaCaribbean small statesCentral African RepublicCentral Europe and the BalticsChadChileChinaColombiaComorosCongo, Dem. Rep.Congo, Rep.Costa RicaCote d'IvoireCroatiaCubaCyprusCzech RepublicDenmarkDominicaDominican RepublicEarly-demographic dividendEast Asia & PacificEast Asia & Pacific (excluding high income)East Asia & Pacific (IDA & IBRD countries)EcuadorEgypt, Arab Rep.El SalvadorEquatorial GuineaEstoniaEthiopiaEuro areaEurope & Central AsiaEurope & Central Asia (excluding high income)Europe & Central Asia (IDA & IBRD countries)European UnionFaroe IslandsFijiFinlandFragile and conflict affected situationsFranceGabonGambia, TheGeorgiaGermanyGhanaGreeceGrenadaGuatemalaGuineaGuinea-BissauGuyanaHeavily indebted poor countries (HIPC)High incomeHondurasHong Kong SAR, ChinaHungaryIBRD onlyIcelandIDA & IBRD totalIDA blendIDA onlyIDA totalIndiaIndonesiaIran, Islamic Rep.IraqIrelandItalyJamaicaJapanJordanKazakhstanKenyaKiribatiKorea, Rep.KosovoKuwaitKyrgyz RepublicLao PDRLate-demographic dividendLatin America & Caribbean Latin America & Caribbean (excluding high income)Latin America & the Caribbean (IDA & IBRD countries)LatviaLeast developed countries: UN classificationLebanonLesothoLiberiaLithuaniaLow & middle incomeLow incomeLower middle incomeLuxembourgMacao SAR, ChinaMacedonia, FYRMadagascarMalawiMalaysiaMaldivesMaliMaltaMarshall IslandsMauritaniaMauritiusMexicoMicronesia, Fed. Sts.Middle East & North AfricaMiddle East & North Africa (excluding high income)Middle East & North Africa (IDA & IBRD countries)Middle incomeMoldovaMongoliaMontenegroMoroccoMozambiqueMyanmarNamibiaNepalNetherlandsNew ZealandNicaraguaNigerNigeriaNorth AmericaNorwayOECD membersOmanOther small statesPacific island small statesPakistanPalauPanamaParaguayPeruPhilippinesPolandPortugalPost-demographic dividendPre-demographic dividendPuerto RicoQatarRomaniaRussian FederationRwandaSamoaSao Tome and PrincipeSaudi ArabiaSenegalSerbiaSeychellesSierra LeoneSingaporeSlovak RepublicSloveniaSmall statesSouth AfricaSouth AsiaSouth Asia (IDA & IBRD)SpainSri LankaSt. Kitts and NevisSt. LuciaSt. Vincent and the GrenadinesSub-Saharan Africa Sub-Saharan Africa (excluding high income)Sub-Saharan Africa (IDA & IBRD countries)SudanSurinameSwazilandSwedenSwitzerlandTajikistanTanzaniaThailandTimor-LesteTogoTongaTrinidad and TobagoTunisiaTurkeyTurkmenistanTuvaluUgandaUkraineUnited Arab EmiratesUnited KingdomUnited StatesUpper middle incomeUruguayUzbekistanVanuatuVenezuela, RBVietnamWest Bank and GazaWorldYemen, Rep.ZambiaZimbabwe línea de tiempo (timeline):
En esta escala de tiempo se presenta un gráfico de 1976 y 2016 de Australia. Los datos de 1975 están ausentes. El número de observaciones reales por fecha: 41.
Fuente (nombre):
Indicadores del desarrollo mundial
Fuente (organización):
World Bank national accounts data, and OECD National Accounts data files.
Categorías:
Economy & Growth
Se ha actualizado:
23 abr 2017 año
Los indicadores de los cambios de valor en los últimos años
Mínimo:
221.0 bn
1 ene 1976 año
Máximo:
855.683 bn
1 ene 2016 año
A la fecha de observación
Valor
Cambio absoluto
El cambio con respecto al valor anterior
1 ene 1976 año
221.0 bn
+221.0 bn
0.0%
1 ene 1977 año
225.625 bn
+4.625 bn
2.09%
1 ene 1978 año
233.182 bn
+7.557 bn
3.35%
1 ene 1979 año
238.365 bn
+5.183 bn
2.22%
1 ene 1980 año
249.904 bn
+11.539 bn
4.84%
1 ene 1981 año
258.173 bn
+8.269 bn
3.31%
1 ene 1982 año
268.963 bn
+10.79 bn
4.18%
1 ene 1983 año
279.937 bn
+10.974 bn
4.08%
1 ene 1984 año
275.286 bn
-4.651 bn
-1.66%
1 ene 1985 año
287.225 bn
+11.939 bn
4.34%
1 ene 1986 año
302.278 bn
+15.053 bn
5.24%
1 ene 1987 año
316.01 bn
+13.732 bn
4.54%
1 ene 1988 año
326.056 bn
+10.046 bn
3.18%
1 ene 1989 año
345.67 bn
+19.614 bn
6.02%
1 ene 1990 año
361.674 bn
+16.004 bn
4.63%
1 ene 1991 año
377.802 bn
+16.128 bn
4.46%
1 ene 1992 año
379.662 bn
+1.86 bn
0.49%
1 ene 1993 año
382.204 bn
+2.542 bn
0.67%
1 ene 1994 año
396.887 bn
+14.683 bn
3.84%
1 ene 1995 año
413.924 bn
+17.036 bn
4.29%
1 ene 1996 año
432.614 bn
+18.69 bn
4.52%
1 ene 1997 año
448.562 bn
+15.948 bn
3.69%
1 ene 1998 año
471.005 bn
+22.443 bn
5.0%
1 ene 1999 año
490.29 bn
+19.285 bn
4.09%
1 ene 2000 año
518.254 bn
+27.964 bn
5.7%
1 ene 2001 año
538.94 bn
+20.686 bn
3.99%
1 ene 2002 año
556.312 bn
+17.372 bn
3.22%
1 ene 2003 año
578.229 bn
+21.918 bn
3.94%
1 ene 2004 año
594.96 bn
+16.73 bn
2.89%
1 ene 2005 año
622.062 bn
+27.102 bn
4.56%
1 ene 2006 año
644.058 bn
+21.996 bn
3.54%
1 ene 2007 año
664.669 bn
+20.611 bn
3.2%
1 ene 2008 año
692.767 bn
+28.098 bn
4.23%
1 ene 2009 año
718.467 bn
+25.7 bn
3.71%
1 ene 2010 año
732.839 bn
+14.372 bn
2.0%
1 ene 2011 año
748.673 bn
+15.834 bn
2.16%
1 ene 2012 año
767.611 bn
+18.937 bn
2.53%
1 ene 2013 año
792.402 bn
+24.792 bn
3.23%
1 ene 2014 año
813.687 bn
+21.285 bn
2.69%
1 ene 2015 año
832.724 bn
+19.037 bn
2.34%
1 ene 2016 año
855.683 bn
+22.959 bn
2.76%
Ranking de los países por los datos estadísticos actuales


Comentarios: