29
/es/
es
AIzaSyAYiBZKx7MnpbEhh9jyipgxe19OcubqV5w
April 1, 2024
188482
Malaysia
MYS
true
2
1
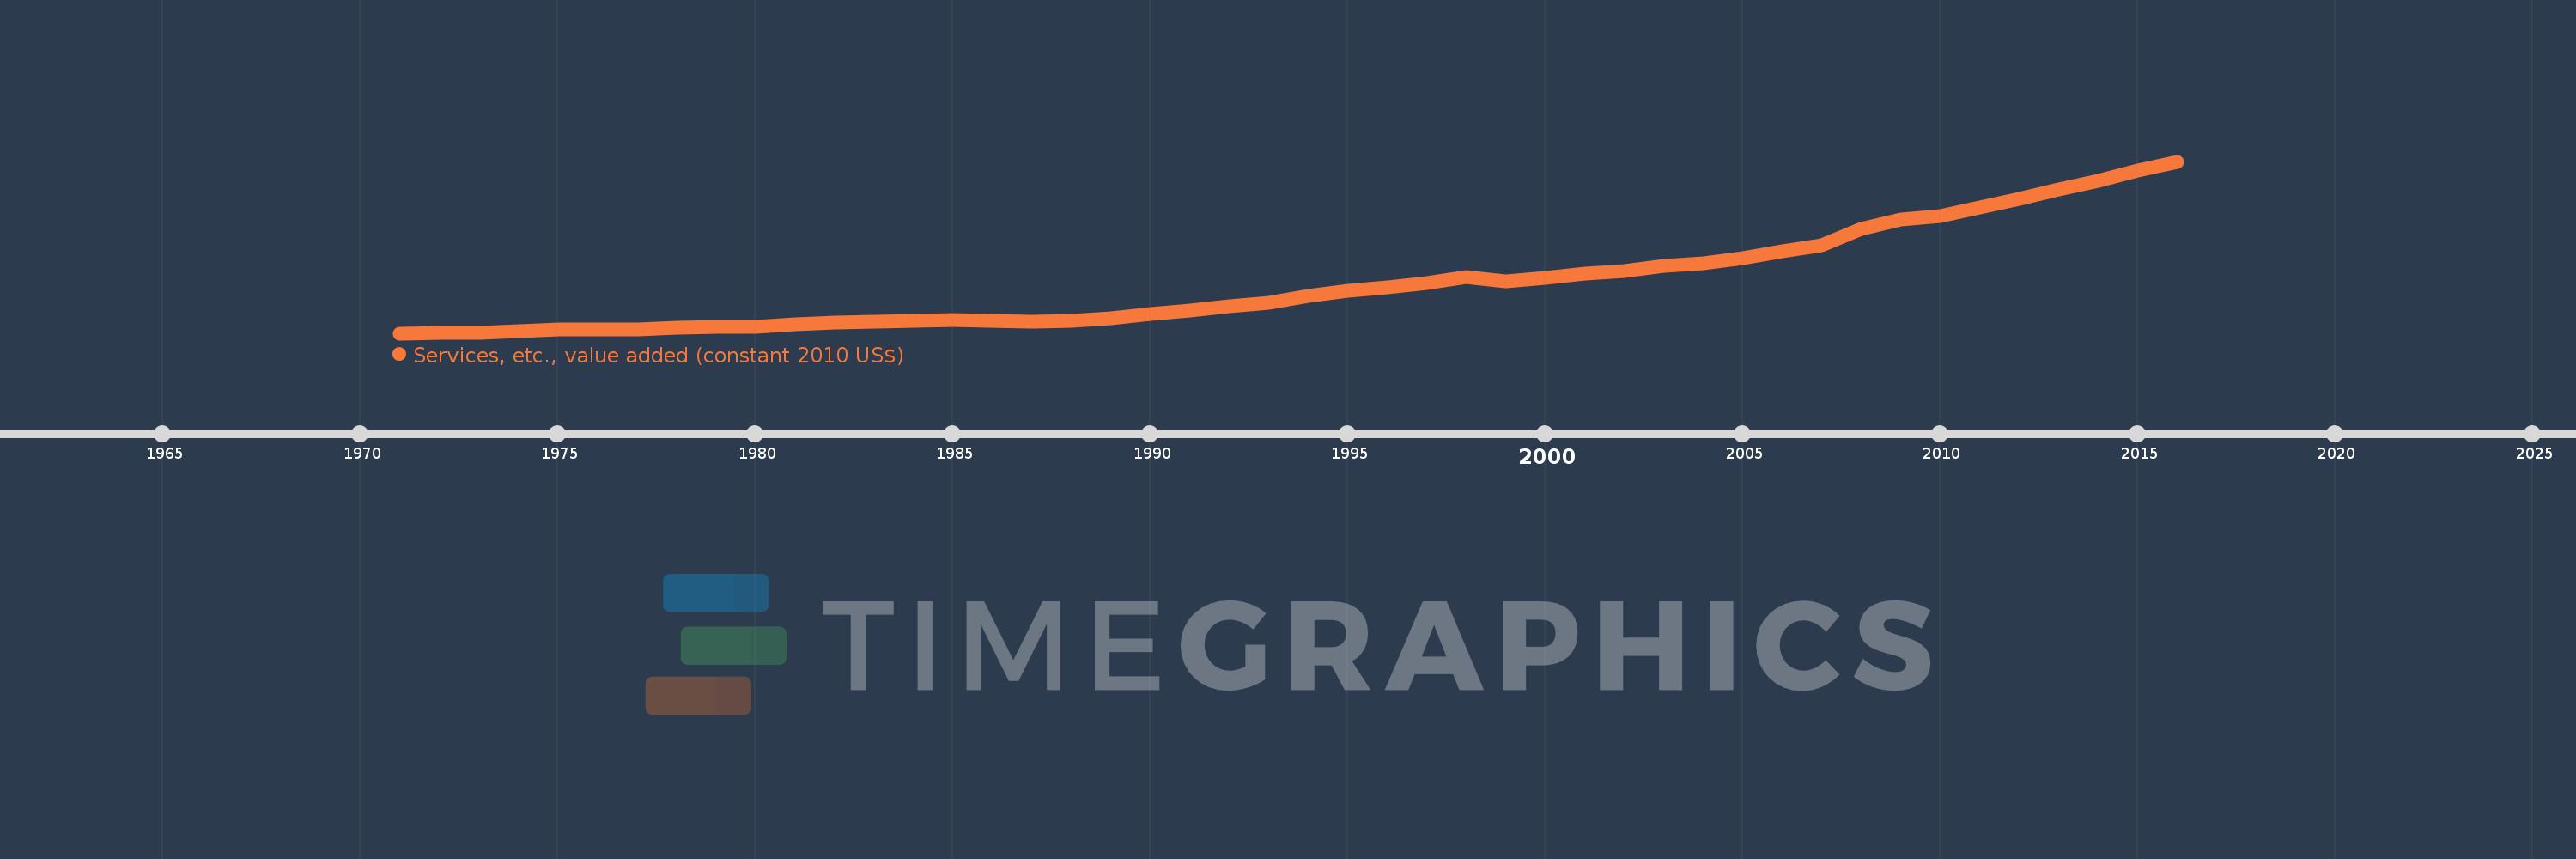
Services, etc., value added (constant 2010 US$)
2016,2015,2014,2013,2012,2011,2010,2009,2008,2007,2006,2005,2004,2003,2002,2001,2000,1999,1998,1997,1996,1995,1994,1993,1992,1991,1990,1989,1988,1987,1986,1985,1984,1983,1982,1981,1980,1979,1978,1977,1976,1975,1974,1973,1972,1971
Estas estadísticas en otros países:
AfghanistanAlbaniaAlgeriaAndorraAntigua and BarbudaArab WorldArgentinaArmeniaArubaAustraliaAustriaAzerbaijanBahamas, TheBahrainBangladeshBarbadosBelarusBelgiumBelizeBeninBermudaBhutanBoliviaBosnia and HerzegovinaBotswanaBrazilBrunei DarussalamBulgariaBurkina FasoBurundiCabo VerdeCambodiaCameroonCanadaCaribbean small statesCentral African RepublicCentral Europe and the BalticsChadChileChinaColombiaComorosCongo, Dem. Rep.Congo, Rep.Costa RicaCote d'IvoireCroatiaCubaCyprusCzech RepublicDenmarkDominicaDominican RepublicEarly-demographic dividendEast Asia & PacificEast Asia & Pacific (excluding high income)East Asia & Pacific (IDA & IBRD countries)EcuadorEgypt, Arab Rep.El SalvadorEquatorial GuineaEstoniaEthiopiaEuro areaEurope & Central AsiaEurope & Central Asia (excluding high income)Europe & Central Asia (IDA & IBRD countries)European UnionFaroe IslandsFijiFinlandFragile and conflict affected situationsFranceGabonGambia, TheGeorgiaGermanyGhanaGreeceGrenadaGuatemalaGuineaGuinea-BissauGuyanaHeavily indebted poor countries (HIPC)High incomeHondurasHong Kong SAR, ChinaHungaryIBRD onlyIcelandIDA & IBRD totalIDA blendIDA onlyIDA totalIndiaIndonesiaIran, Islamic Rep.IraqIrelandItalyJamaicaJapanJordanKazakhstanKenyaKiribatiKorea, Rep.KosovoKuwaitKyrgyz RepublicLao PDRLate-demographic dividendLatin America & Caribbean Latin America & Caribbean (excluding high income)Latin America & the Caribbean (IDA & IBRD countries)LatviaLeast developed countries: UN classificationLebanonLesothoLiberiaLithuaniaLow & middle incomeLow incomeLower middle incomeLuxembourgMacao SAR, ChinaMacedonia, FYRMadagascarMalawiMalaysiaMaldivesMaliMaltaMarshall IslandsMauritaniaMauritiusMexicoMicronesia, Fed. Sts.Middle East & North AfricaMiddle East & North Africa (excluding high income)Middle East & North Africa (IDA & IBRD countries)Middle incomeMoldovaMongoliaMontenegroMoroccoMozambiqueMyanmarNamibiaNepalNetherlandsNew ZealandNicaraguaNigerNigeriaNorth AmericaNorwayOECD membersOmanOther small statesPacific island small statesPakistanPalauPanamaParaguayPeruPhilippinesPolandPortugalPost-demographic dividendPre-demographic dividendPuerto RicoQatarRomaniaRussian FederationRwandaSamoaSao Tome and PrincipeSaudi ArabiaSenegalSerbiaSeychellesSierra LeoneSingaporeSlovak RepublicSloveniaSmall statesSouth AfricaSouth AsiaSouth Asia (IDA & IBRD)SpainSri LankaSt. Kitts and NevisSt. LuciaSt. Vincent and the GrenadinesSub-Saharan Africa Sub-Saharan Africa (excluding high income)Sub-Saharan Africa (IDA & IBRD countries)SudanSurinameSwazilandSwedenSwitzerlandTajikistanTanzaniaThailandTimor-LesteTogoTongaTrinidad and TobagoTunisiaTurkeyTurkmenistanTuvaluUgandaUkraineUnited Arab EmiratesUnited KingdomUnited StatesUpper middle incomeUruguayUzbekistanVanuatuVenezuela, RBVietnamWest Bank and GazaWorldYemen, Rep.ZambiaZimbabwe línea de tiempo (timeline):
En esta escala de tiempo se presenta un gráfico de 1971 y 2016 de Malaysia. Los datos de 1970 están ausentes. El número de observaciones reales por fecha: 46.
Fuente (nombre):
Indicadores del desarrollo mundial
Fuente (organización):
World Bank national accounts data, and OECD National Accounts data files.
Categorías:
Economy & Growth
Se ha actualizado:
23 abr 2017 año
Los indicadores de los cambios de valor en los últimos años
Mínimo:
2.809 bn
1 ene 1971 año
Máximo:
180.899 bn
1 ene 2016 año
A la fecha de observación
Valor
Cambio absoluto
El cambio con respecto al valor anterior
1 ene 1971 año
2.809 bn
+2.809 bn
0.0%
1 ene 1972 año
2.996 bn
+187.067 millones
6.66%
1 ene 1973 año
3.639 bn
+643.028 millones
21.46%
1 ene 1974 año
5.038 bn
+1.399 bn
38.45%
1 ene 1975 año
6.643 bn
+1.604 bn
31.84%
1 ene 1976 año
7.245 bn
+602.07 millones
9.06%
1 ene 1977 año
7.122 bn
-122.85 millones
-1.7%
1 ene 1978 año
8.671 bn
+1.549 bn
21.75%
1 ene 1979 año
9.343 bn
+671.4 millones
7.74%
1 ene 1980 año
9.72 bn
+377.707 millones
4.04%
1 ene 1981 año
12.006 bn
+2.286 bn
23.51%
1 ene 1982 año
14.345 bn
+2.339 bn
19.48%
1 ene 1983 año
14.875 bn
+530.319 millones
3.7%
1 ene 1984 año
15.44 bn
+565.099 millones
3.8%
1 ene 1985 año
16.274 bn
+833.195 millones
5.4%
1 ene 1986 año
16.108 bn
-165.567 millones
-1.02%
1 ene 1987 año
14.903 bn
-1.205 bn
-7.48%
1 ene 1988 año
15.872 bn
+969.493 millones
6.51%
1 ene 1989 año
18.01 bn
+2.137 bn
13.46%
1 ene 1990 año
22.581 bn
+4.572 bn
25.38%
1 ene 1991 año
26.767 bn
+4.186 bn
18.54%
1 ene 1992 año
30.757 bn
+3.989 bn
14.9%
1 ene 1993 año
34.719 bn
+3.962 bn
12.88%
1 ene 1994 año
41.664 bn
+6.945 bn
20.0%
1 ene 1995 año
47.201 bn
+5.537 bn
13.29%
1 ene 1996 año
50.619 bn
+3.419 bn
7.24%
1 ene 1997 año
55.329 bn
+4.71 bn
9.3%
1 ene 1998 año
60.985 bn
+5.656 bn
10.22%
1 ene 1999 año
57.049 bn
-3.936 bn
-6.45%
1 ene 2000 año
60.2 bn
+3.151 bn
5.52%
1 ene 2001 año
64.71 bn
+4.511 bn
7.49%
1 ene 2002 año
67.55 bn
+2.84 bn
4.39%
1 ene 2003 año
72.598 bn
+5.047 bn
7.47%
1 ene 2004 año
75.474 bn
+2.876 bn
3.96%
1 ene 2005 año
80.869 bn
+5.395 bn
7.15%
1 ene 2006 año
87.798 bn
+6.929 bn
8.57%
1 ene 2007 año
93.852 bn
+6.054 bn
6.9%
1 ene 2008 año
111.36 bn
+17.508 bn
18.66%
1 ene 2009 año
120.981 bn
+9.62 bn
8.64%
1 ene 2010 año
123.951 bn
+2.971 bn
2.46%
1 ene 2011 año
132.89 bn
+8.938 bn
7.21%
1 ene 2012 año
142.345 bn
+9.455 bn
7.12%
1 ene 2013 año
151.906 bn
+9.562 bn
6.72%
1 ene 2014 año
160.929 bn
+9.022 bn
5.94%
1 ene 2015 año
171.59 bn
+10.661 bn
6.62%
1 ene 2016 año
180.899 bn
+9.309 bn
5.43%
Ranking de los países por los datos estadísticos actuales


Comentarios: