29
/es/
es
AIzaSyAYiBZKx7MnpbEhh9jyipgxe19OcubqV5w
April 1, 2024
166856
Kazakhstan
KAZ
true
2
1
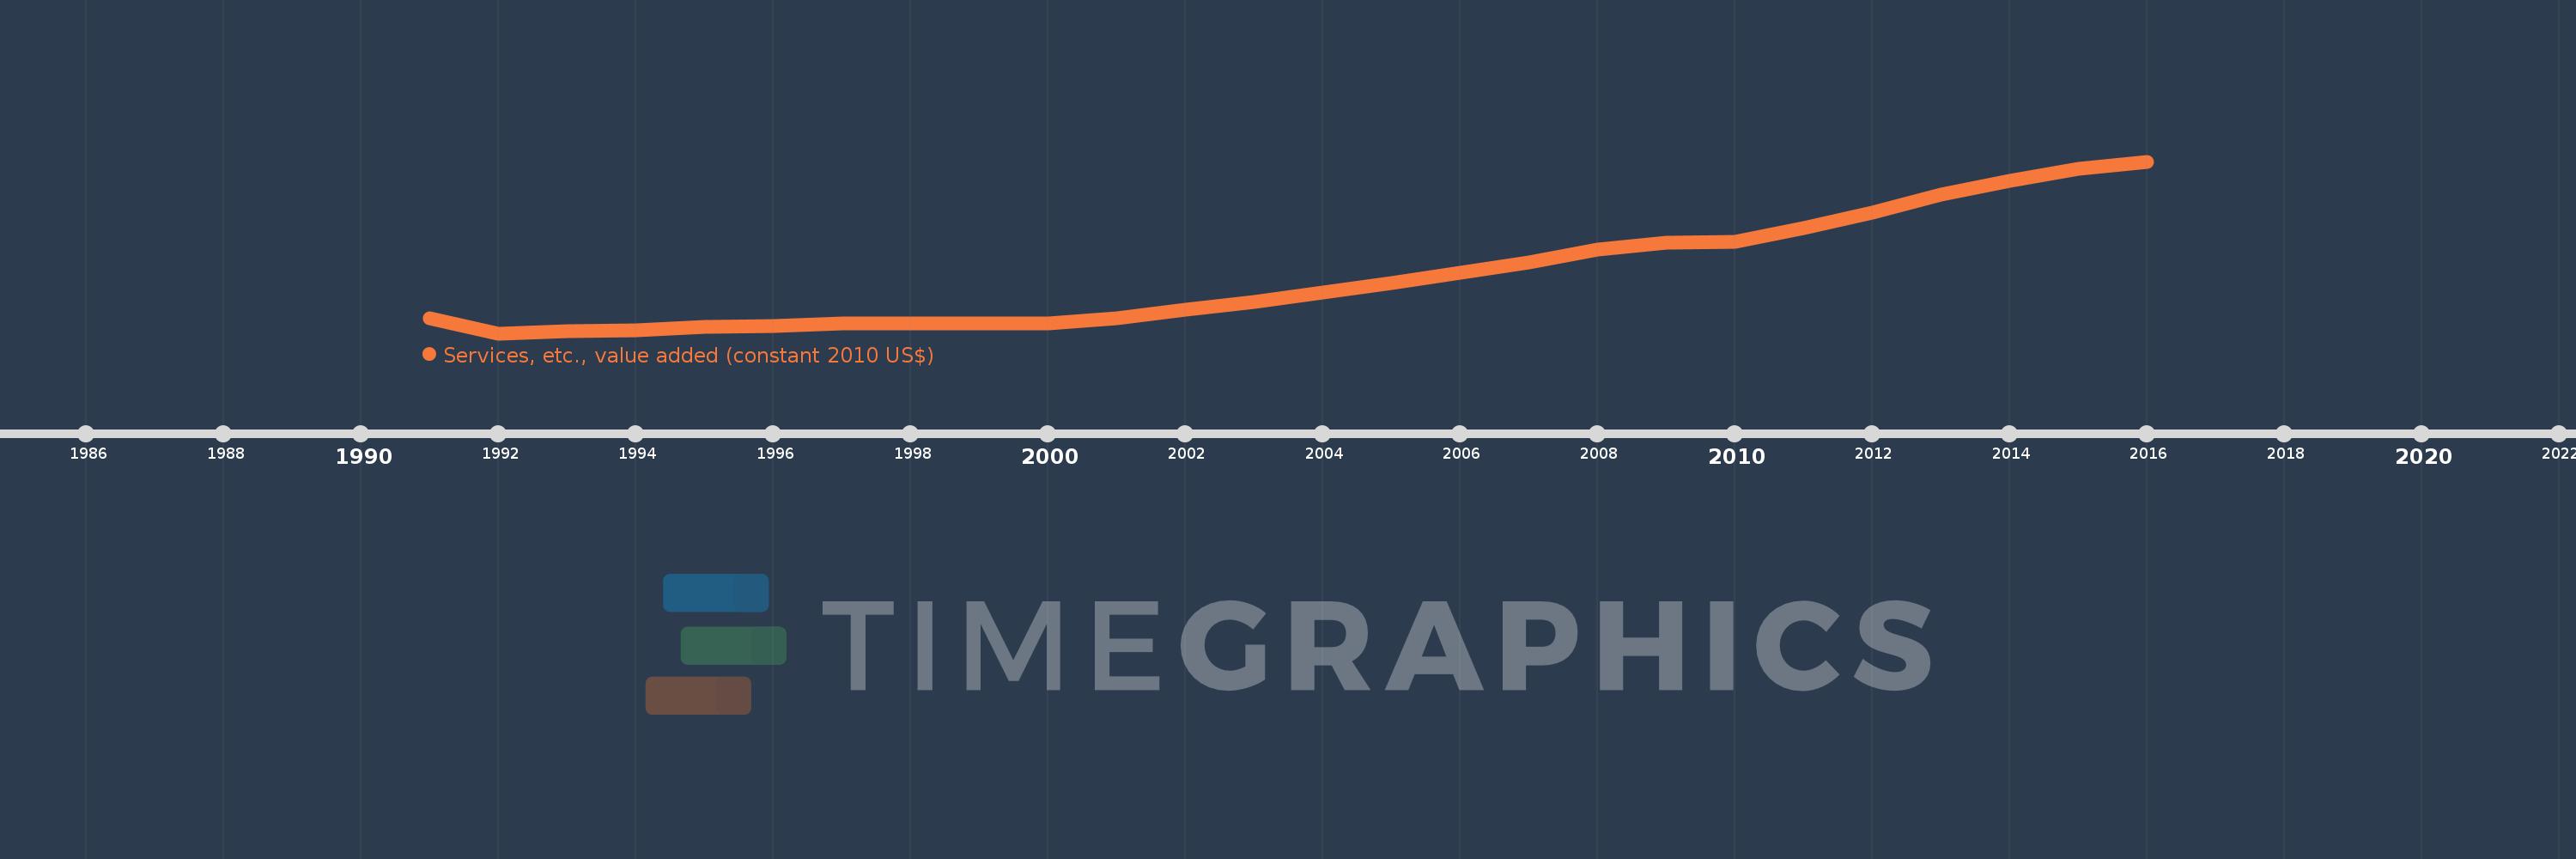
Services, etc., value added (constant 2010 US$)
2016,2015,2014,2013,2012,2011,2010,2009,2008,2007,2006,2005,2004,2003,2002,2001,2000,1999,1998,1997,1996,1995,1994,1993,1992,1991
Estas estadísticas en otros países:
AfghanistanAlbaniaAlgeriaAndorraAntigua and BarbudaArab WorldArgentinaArmeniaArubaAustraliaAustriaAzerbaijanBahamas, TheBahrainBangladeshBarbadosBelarusBelgiumBelizeBeninBermudaBhutanBoliviaBosnia and HerzegovinaBotswanaBrazilBrunei DarussalamBulgariaBurkina FasoBurundiCabo VerdeCambodiaCameroonCanadaCaribbean small statesCentral African RepublicCentral Europe and the BalticsChadChileChinaColombiaComorosCongo, Dem. Rep.Congo, Rep.Costa RicaCote d'IvoireCroatiaCubaCyprusCzech RepublicDenmarkDominicaDominican RepublicEarly-demographic dividendEast Asia & PacificEast Asia & Pacific (excluding high income)East Asia & Pacific (IDA & IBRD countries)EcuadorEgypt, Arab Rep.El SalvadorEquatorial GuineaEstoniaEthiopiaEuro areaEurope & Central AsiaEurope & Central Asia (excluding high income)Europe & Central Asia (IDA & IBRD countries)European UnionFaroe IslandsFijiFinlandFragile and conflict affected situationsFranceGabonGambia, TheGeorgiaGermanyGhanaGreeceGrenadaGuatemalaGuineaGuinea-BissauGuyanaHeavily indebted poor countries (HIPC)High incomeHondurasHong Kong SAR, ChinaHungaryIBRD onlyIcelandIDA & IBRD totalIDA blendIDA onlyIDA totalIndiaIndonesiaIran, Islamic Rep.IraqIrelandItalyJamaicaJapanJordanKazakhstanKenyaKiribatiKorea, Rep.KosovoKuwaitKyrgyz RepublicLao PDRLate-demographic dividendLatin America & Caribbean Latin America & Caribbean (excluding high income)Latin America & the Caribbean (IDA & IBRD countries)LatviaLeast developed countries: UN classificationLebanonLesothoLiberiaLithuaniaLow & middle incomeLow incomeLower middle incomeLuxembourgMacao SAR, ChinaMacedonia, FYRMadagascarMalawiMalaysiaMaldivesMaliMaltaMarshall IslandsMauritaniaMauritiusMexicoMicronesia, Fed. Sts.Middle East & North AfricaMiddle East & North Africa (excluding high income)Middle East & North Africa (IDA & IBRD countries)Middle incomeMoldovaMongoliaMontenegroMoroccoMozambiqueMyanmarNamibiaNepalNetherlandsNew ZealandNicaraguaNigerNigeriaNorth AmericaNorwayOECD membersOmanOther small statesPacific island small statesPakistanPalauPanamaParaguayPeruPhilippinesPolandPortugalPost-demographic dividendPre-demographic dividendPuerto RicoQatarRomaniaRussian FederationRwandaSamoaSao Tome and PrincipeSaudi ArabiaSenegalSerbiaSeychellesSierra LeoneSingaporeSlovak RepublicSloveniaSmall statesSouth AfricaSouth AsiaSouth Asia (IDA & IBRD)SpainSri LankaSt. Kitts and NevisSt. LuciaSt. Vincent and the GrenadinesSub-Saharan Africa Sub-Saharan Africa (excluding high income)Sub-Saharan Africa (IDA & IBRD countries)SudanSurinameSwazilandSwedenSwitzerlandTajikistanTanzaniaThailandTimor-LesteTogoTongaTrinidad and TobagoTunisiaTurkeyTurkmenistanTuvaluUgandaUkraineUnited Arab EmiratesUnited KingdomUnited StatesUpper middle incomeUruguayUzbekistanVanuatuVenezuela, RBVietnamWest Bank and GazaWorldYemen, Rep.ZambiaZimbabwe línea de tiempo (timeline):
En esta escala de tiempo se presenta un gráfico de 1991 y 2016 de Kazakhstan. Los datos de 1990 están ausentes. El número de observaciones reales por fecha: 26.
Fuente (nombre):
Indicadores del desarrollo mundial
Fuente (organización):
World Bank national accounts data, and OECD National Accounts data files.
Categorías:
Economy & Growth
Se ha actualizado:
23 abr 2017 año
Los indicadores de los cambios de valor en los últimos años
Mínimo:
26.339 bn
1 ene 1992 año
Máximo:
102.817 bn
1 ene 2016 año
A la fecha de observación
Valor
Cambio absoluto
El cambio con respecto al valor anterior
1 ene 1991 año
33.174 bn
+33.174 bn
0.0%
1 ene 1992 año
26.339 bn
-6.835 bn
-20.6%
1 ene 1993 año
27.384 bn
+1.045 bn
3.97%
1 ene 1994 año
27.498 bn
+114.075 millones
0.42%
1 ene 1995 año
29.359 bn
+1.861 bn
6.77%
1 ene 1996 año
29.492 bn
+132.82 millones
0.45%
1 ene 1997 año
30.636 bn
+1.144 bn
3.88%
1 ene 1998 año
30.728 bn
+91.558 millones
0.3%
1 ene 1999 año
30.829 bn
+100.994 millones
0.33%
1 ene 2000 año
30.601 bn
-227.445 millones
-0.74%
1 ene 2001 año
33.113 bn
+2.512 bn
8.21%
1 ene 2002 año
36.873 bn
+3.76 bn
11.35%
1 ene 2003 año
40.254 bn
+3.381 bn
9.17%
1 ene 2004 año
44.502 bn
+4.248 bn
10.55%
1 ene 2005 año
48.838 bn
+4.336 bn
9.74%
1 ene 2006 año
53.155 bn
+4.317 bn
8.84%
1 ene 2007 año
57.993 bn
+4.838 bn
9.1%
1 ene 2008 año
63.461 bn
+5.468 bn
9.43%
1 ene 2009 año
66.673 bn
+3.211 bn
5.06%
1 ene 2010 año
66.931 bn
+258.26 millones
0.39%
1 ene 2011 año
73.343 bn
+6.412 bn
9.58%
1 ene 2012 año
79.944 bn
+6.601 bn
9.0%
1 ene 2013 año
88.258 bn
+8.314 bn
10.4%
1 ene 2014 año
94.347 bn
+6.09 bn
6.9%
1 ene 2015 año
99.725 bn
+5.378 bn
5.7%
1 ene 2016 año
102.817 bn
+3.091 bn
3.1%
Ranking de los países por los datos estadísticos actuales


Comentarios: