29
/es/
es
AIzaSyAYiBZKx7MnpbEhh9jyipgxe19OcubqV5w
April 1, 2024
62198
Upper middle income
UMC
false
2
1
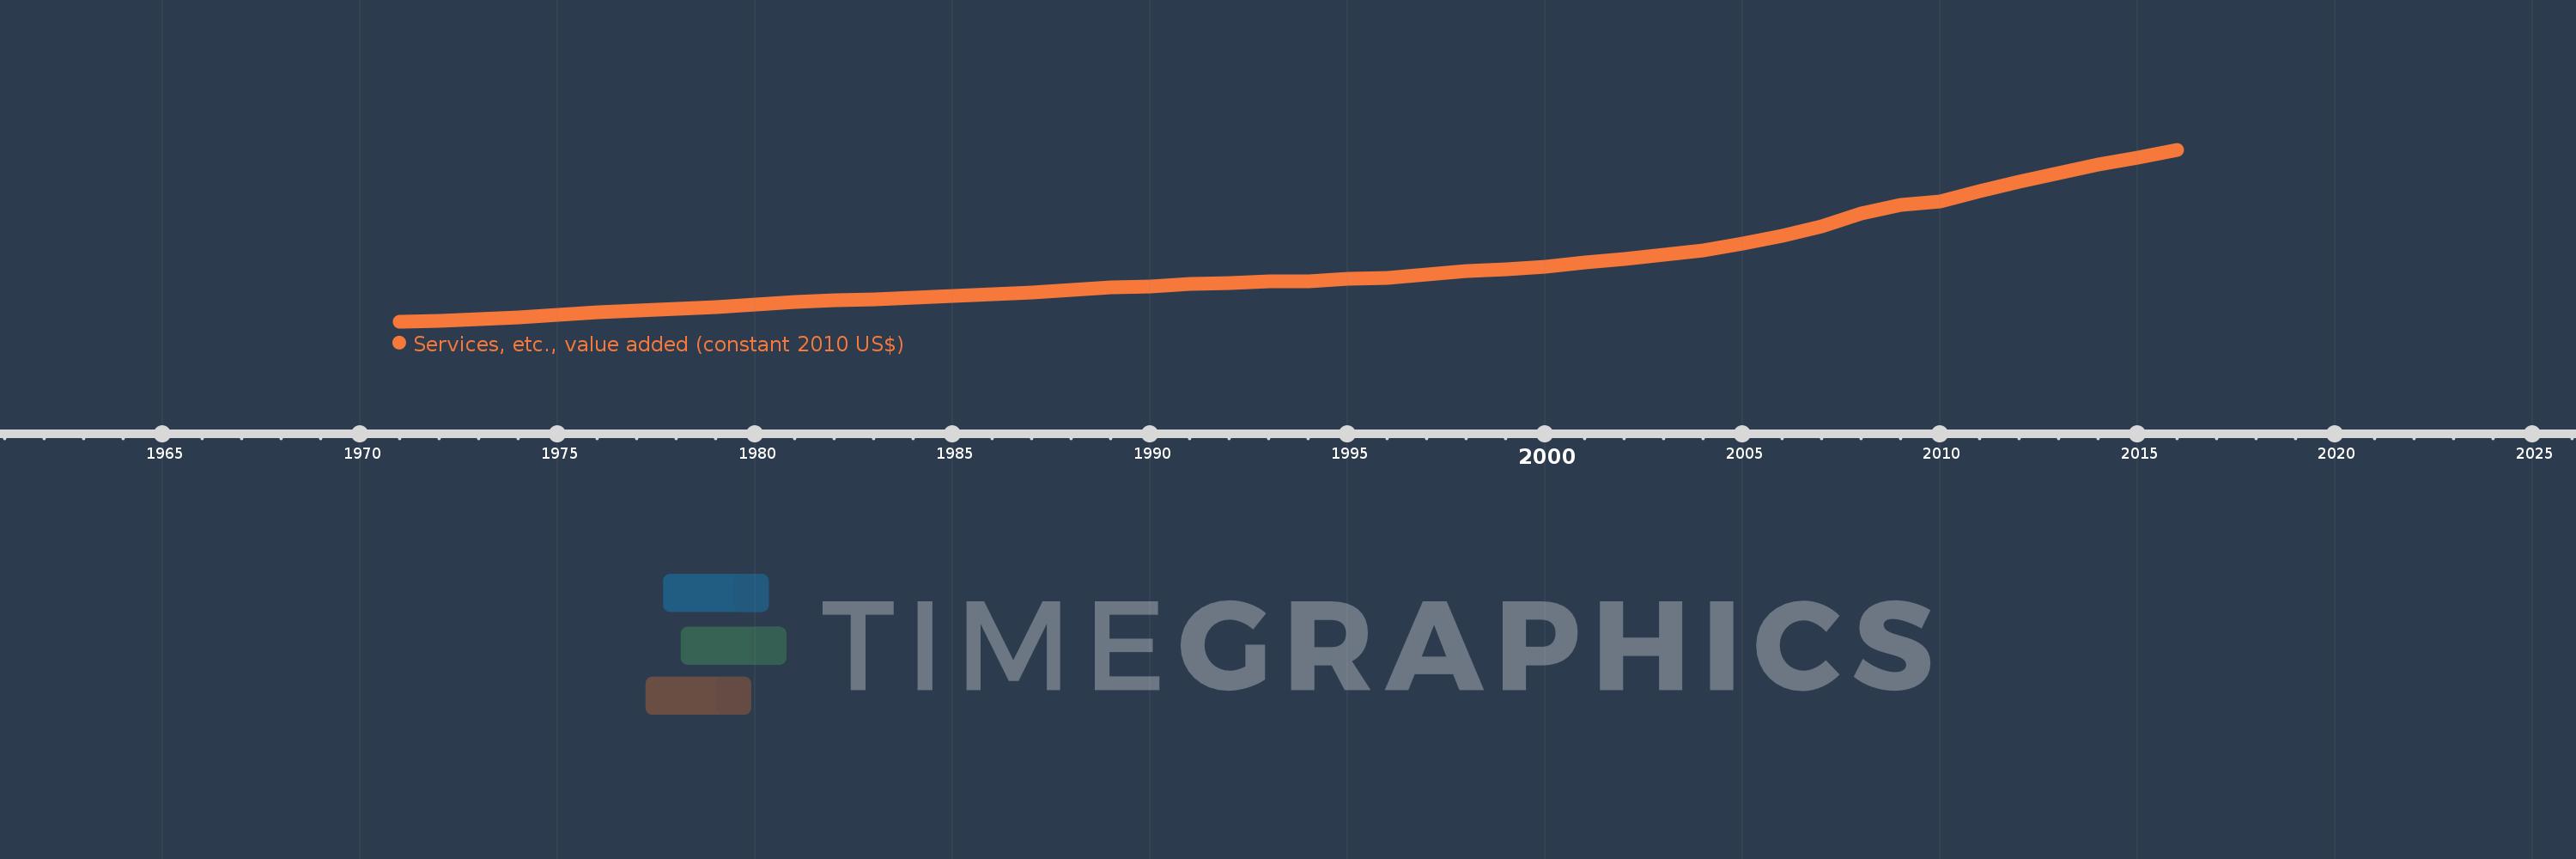
Services, etc., value added (constant 2010 US$)
2016,2015,2014,2013,2012,2011,2010,2009,2008,2007,2006,2005,2004,2003,2002,2001,2000,1999,1998,1997,1996,1995,1994,1993,1992,1991,1990,1989,1988,1987,1986,1985,1984,1983,1982,1981,1980,1979,1978,1977,1976,1975,1974,1973,1972,1971
Estas estadísticas en otros países:
AfghanistanAlbaniaAlgeriaAndorraAntigua and BarbudaArab WorldArgentinaArmeniaArubaAustraliaAustriaAzerbaijanBahamas, TheBahrainBangladeshBarbadosBelarusBelgiumBelizeBeninBermudaBhutanBoliviaBosnia and HerzegovinaBotswanaBrazilBrunei DarussalamBulgariaBurkina FasoBurundiCabo VerdeCambodiaCameroonCanadaCaribbean small statesCentral African RepublicCentral Europe and the BalticsChadChileChinaColombiaComorosCongo, Dem. Rep.Congo, Rep.Costa RicaCote d'IvoireCroatiaCubaCyprusCzech RepublicDenmarkDominicaDominican RepublicEarly-demographic dividendEast Asia & PacificEast Asia & Pacific (excluding high income)East Asia & Pacific (IDA & IBRD countries)EcuadorEgypt, Arab Rep.El SalvadorEquatorial GuineaEstoniaEthiopiaEuro areaEurope & Central AsiaEurope & Central Asia (excluding high income)Europe & Central Asia (IDA & IBRD countries)European UnionFaroe IslandsFijiFinlandFragile and conflict affected situationsFranceGabonGambia, TheGeorgiaGermanyGhanaGreeceGrenadaGuatemalaGuineaGuinea-BissauGuyanaHeavily indebted poor countries (HIPC)High incomeHondurasHong Kong SAR, ChinaHungaryIBRD onlyIcelandIDA & IBRD totalIDA blendIDA onlyIDA totalIndiaIndonesiaIran, Islamic Rep.IraqIrelandItalyJamaicaJapanJordanKazakhstanKenyaKiribatiKorea, Rep.KosovoKuwaitKyrgyz RepublicLao PDRLate-demographic dividendLatin America & Caribbean Latin America & Caribbean (excluding high income)Latin America & the Caribbean (IDA & IBRD countries)LatviaLeast developed countries: UN classificationLebanonLesothoLiberiaLithuaniaLow & middle incomeLow incomeLower middle incomeLuxembourgMacao SAR, ChinaMacedonia, FYRMadagascarMalawiMalaysiaMaldivesMaliMaltaMarshall IslandsMauritaniaMauritiusMexicoMicronesia, Fed. Sts.Middle East & North AfricaMiddle East & North Africa (excluding high income)Middle East & North Africa (IDA & IBRD countries)Middle incomeMoldovaMongoliaMontenegroMoroccoMozambiqueMyanmarNamibiaNepalNetherlandsNew ZealandNicaraguaNigerNigeriaNorth AmericaNorwayOECD membersOmanOther small statesPacific island small statesPakistanPalauPanamaParaguayPeruPhilippinesPolandPortugalPost-demographic dividendPre-demographic dividendPuerto RicoQatarRomaniaRussian FederationRwandaSamoaSao Tome and PrincipeSaudi ArabiaSenegalSerbiaSeychellesSierra LeoneSingaporeSlovak RepublicSloveniaSmall statesSouth AfricaSouth AsiaSouth Asia (IDA & IBRD)SpainSri LankaSt. Kitts and NevisSt. LuciaSt. Vincent and the GrenadinesSub-Saharan Africa Sub-Saharan Africa (excluding high income)Sub-Saharan Africa (IDA & IBRD countries)SudanSurinameSwazilandSwedenSwitzerlandTajikistanTanzaniaThailandTimor-LesteTogoTongaTrinidad and TobagoTunisiaTurkeyTurkmenistanTuvaluUgandaUkraineUnited Arab EmiratesUnited KingdomUnited StatesUpper middle incomeUruguayUzbekistanVanuatuVenezuela, RBVietnamWest Bank and GazaWorldYemen, Rep.ZambiaZimbabwe línea de tiempo (timeline):
En esta escala de tiempo se presenta un gráfico de 1971 y 2016 de Upper middle income. Los datos de 1970 están ausentes. El número de observaciones reales por fecha: 46.
Fuente (nombre):
Indicadores del desarrollo mundial
Fuente (organización):
World Bank national accounts data, and OECD National Accounts data files.
Categorías:
Economy & Growth
Se ha actualizado:
23 abr 2017 año
Los indicadores de los cambios de valor en los últimos años
En promedio:
4.083 billones
Mínimo:
1.199 billones
1 ene 1971 año
Máximo:
9.989 billones
1 ene 2016 año
A la fecha de observación
Valor
Cambio absoluto
El cambio con respecto al valor anterior
1 ene 1971 año
1.199 billones
+1.199 billones
0.0%
1 ene 1972 año
1.273 billones
+73.432 bn
6.12%
1 ene 1973 año
1.36 billones
+87.454 bn
6.87%
1 ene 1974 año
1.435 billones
+74.753 bn
5.5%
1 ene 1975 año
1.568 billones
+132.829 bn
9.26%
1 ene 1976 año
1.688 billones
+119.812 bn
7.64%
1 ene 1977 año
1.781 billones
+93.88 bn
5.56%
1 ene 1978 año
1.882 billones
+100.39 bn
5.64%
1 ene 1979 año
1.97 billones
+88.281 bn
4.69%
1 ene 1980 año
2.093 billones
+122.589 bn
6.22%
1 ene 1981 año
2.21 billones
+117.81 bn
5.63%
1 ene 1982 año
2.324 billones
+113.182 bn
5.12%
1 ene 1983 año
2.37 billones
+46.321 bn
1.99%
1 ene 1984 año
2.427 billones
+56.588 bn
2.39%
1 ene 1985 año
2.539 billones
+111.964 bn
4.61%
1 ene 1986 año
2.63 billones
+91.033 bn
3.59%
1 ene 1987 año
2.695 billones
+64.95 bn
2.47%
1 ene 1988 año
2.85 billones
+155.364 bn
5.77%
1 ene 1989 año
2.961 billones
+110.669 bn
3.88%
1 ene 1990 año
3.03 billones
+69.19 bn
2.34%
1 ene 1991 año
3.145 billones
+114.92 bn
3.79%
1 ene 1992 año
3.21 billones
+65.409 bn
2.08%
1 ene 1993 año
3.269 billones
+59.146 bn
1.84%
1 ene 1994 año
3.298 billones
+28.627 bn
0.88%
1 ene 1995 año
3.409 billones
+111.259 bn
3.37%
1 ene 1996 año
3.463 billones
+54.326 bn
1.59%
1 ene 1997 año
3.643 billones
+179.328 bn
5.18%
1 ene 1998 año
3.816 billones
+173.698 bn
4.77%
1 ene 1999 año
3.912 billones
+95.781 bn
2.51%
1 ene 2000 año
4.038 billones
+125.858 bn
3.22%
1 ene 2001 año
4.263 billones
+224.746 bn
5.57%
1 ene 2002 año
4.429 billones
+166.044 bn
3.9%
1 ene 2003 año
4.634 billones
+204.84 bn
4.63%
1 ene 2004 año
4.849 billones
+215.24 bn
4.65%
1 ene 2005 año
5.21 billones
+360.977 bn
7.44%
1 ene 2006 año
5.612 billones
+402.432 bn
7.72%
1 ene 2007 año
6.112 billones
+499.47 bn
8.9%
1 ene 2008 año
6.744 billones
+632.204 bn
10.34%
1 ene 2009 año
7.182 billones
+437.567 bn
6.49%
1 ene 2010 año
7.37 billones
+187.976 bn
2.62%
1 ene 2011 año
7.878 billones
+508.558 bn
6.9%
1 ene 2012 año
8.377 billones
+498.508 bn
6.33%
1 ene 2013 año
8.819 billones
+442.296 bn
5.28%
1 ene 2014 año
9.249 billones
+430.395 bn
4.88%
1 ene 2015 año
9.626 billones
+376.445 bn
4.07%
1 ene 2016 año
9.989 billones
+363.165 bn
3.77%
Ranking de los países por los datos estadísticos actuales


Comentarios: