29
/es/
es
AIzaSyAYiBZKx7MnpbEhh9jyipgxe19OcubqV5w
April 1, 2024
67488
Angola
AGO
true
2
1
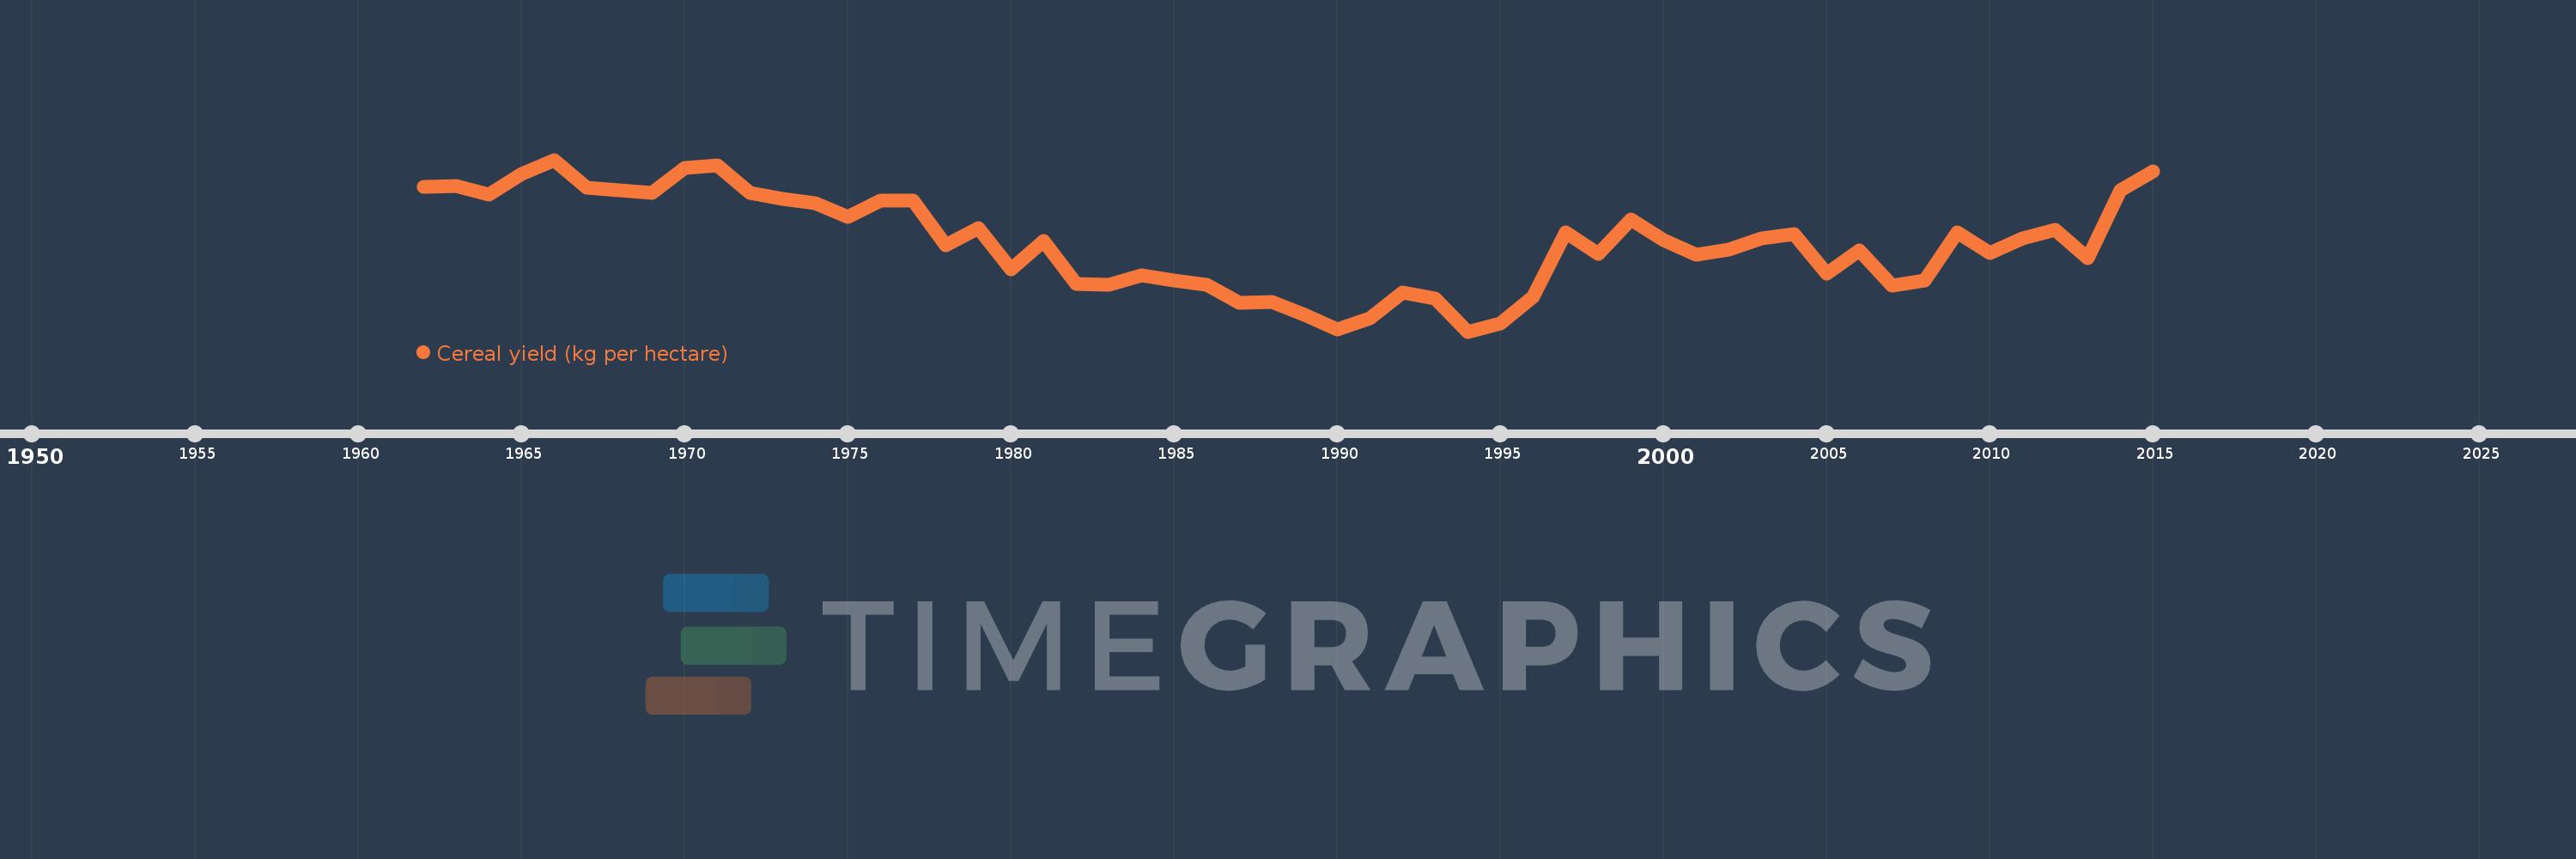
Cereal yield (kg per hectare)
2015,2014,2013,2012,2011,2010,2009,2008,2007,2006,2005,2004,2003,2002,2001,2000,1999,1998,1997,1996,1995,1994,1993,1992,1991,1990,1989,1988,1987,1986,1985,1984,1983,1982,1981,1980,1979,1978,1977,1976,1975,1974,1973,1972,1971,1970,1969,1968,1967,1966,1965,1964,1963,1962
Estas estadísticas en otros países:
AfghanistanAlbaniaAlgeriaAngolaAntigua and BarbudaArab WorldArgentinaArmeniaAustraliaAustriaAzerbaijanBahamas, TheBangladeshBarbadosBelarusBelgiumBelizeBeninBhutanBoliviaBosnia and HerzegovinaBotswanaBrazilBrunei DarussalamBulgariaBurkina FasoBurundiCabo VerdeCambodiaCameroonCanadaCaribbean small statesCentral African RepublicCentral Europe and the BalticsChadChileChinaColombiaComorosCongo, Dem. Rep.Congo, Rep.Costa RicaCote d'IvoireCroatiaCubaCyprusCzech RepublicDenmarkDjiboutiDominicaDominican RepublicEarly-demographic dividendEast Asia & PacificEast Asia & Pacific (excluding high income)East Asia & Pacific (IDA & IBRD countries)EcuadorEgypt, Arab Rep.El SalvadorEritreaEstoniaEthiopiaEuro areaEurope & Central AsiaEurope & Central Asia (excluding high income)Europe & Central Asia (IDA & IBRD countries)European UnionFijiFinlandFragile and conflict affected situationsFranceGabonGambia, TheGeorgiaGermanyGhanaGreeceGrenadaGuamGuatemalaGuineaGuinea-BissauGuyanaHaitiHeavily indebted poor countries (HIPC)High incomeHondurasHong Kong SAR, ChinaHungaryIBRD onlyIDA & IBRD totalIDA blendIDA onlyIDA totalIndiaIndonesiaIran, Islamic Rep.IraqIrelandIsraelItalyJamaicaJapanJordanKazakhstanKenyaKorea, Dem. People’s Rep.Korea, Rep.KuwaitKyrgyz RepublicLao PDRLate-demographic dividendLatin America & Caribbean Latin America & Caribbean (excluding high income)Latin America & the Caribbean (IDA & IBRD countries)LatviaLeast developed countries: UN classificationLebanonLesothoLiberiaLibyaLithuaniaLow & middle incomeLow incomeLower middle incomeLuxembourgMacedonia, FYRMadagascarMalawiMalaysiaMaldivesMaliMaltaMauritaniaMauritiusMexicoMicronesia, Fed. Sts.Middle East & North AfricaMiddle East & North Africa (excluding high income)Middle East & North Africa (IDA & IBRD countries)Middle incomeMoldovaMongoliaMontenegroMoroccoMozambiqueMyanmarNamibiaNepalNetherlandsNew CaledoniaNew ZealandNicaraguaNigerNigeriaNorth AmericaNorwayOECD membersOmanOther small statesPacific island small statesPakistanPanamaPapua New GuineaParaguayPeruPhilippinesPolandPortugalPost-demographic dividendPre-demographic dividendPuerto RicoQatarRomaniaRussian FederationRwandaSao Tome and PrincipeSaudi ArabiaSenegalSerbiaSierra LeoneSlovak RepublicSloveniaSmall statesSolomon IslandsSomaliaSouth AfricaSouth AsiaSouth Asia (IDA & IBRD)South SudanSpainSri LankaSt. LuciaSt. Vincent and the GrenadinesSub-Saharan Africa Sub-Saharan Africa (excluding high income)Sub-Saharan Africa (IDA & IBRD countries)SudanSurinameSwazilandSwedenSwitzerlandSyrian Arab RepublicTajikistanTanzaniaThailandTimor-LesteTogoTrinidad and TobagoTunisiaTurkeyTurkmenistanUgandaUkraineUnited Arab EmiratesUnited KingdomUnited StatesUpper middle incomeUruguayUzbekistanVanuatuVenezuela, RBVietnamWest Bank and GazaWorldYemen, Rep.ZambiaZimbabwe línea de tiempo (timeline):
En esta escala de tiempo se presenta un gráfico de 1962 y 2015 de Angola. Los datos de 1961 están ausentes. El número de observaciones reales por fecha: 54.
Fuente (nombre):
Indicadores del desarrollo mundial
Fuente (organización):
Food and Agriculture Organization, electronic files and web site.
Categorías:
Agriculture & Rural Development, Climate Change
Se ha actualizado:
23 abr 2017 año
Los indicadores de los cambios de valor en los últimos años
Mínimo:
268.0
1 ene 1994 año
Máximo:
932.0
1 ene 1966 año
A la fecha de observación
Valor
Cambio absoluto
El cambio con respecto al valor anterior
1 ene 1962 año
828.0
+828.0
0.0%
1 ene 1963 año
830.3
+2.3
0.28%
1 ene 1964 año
798.4
-31.9
-3.84%
1 ene 1965 año
875.8
+77.4
9.69%
1 ene 1966 año
932.0
+56.2
6.42%
1 ene 1967 año
824.3
-107.7
-11.56%
1 ene 1968 año
814.6
-9.7
-1.18%
1 ene 1969 año
805.7
-8.9
-1.09%
1 ene 1970 año
898.9
+93.2
11.57%
1 ene 1971 año
911.3
+12.4
1.38%
1 ene 1972 año
805.7
-105.6
-11.59%
1 ene 1973 año
780.3
-25.4
-3.15%
1 ene 1974 año
764.0
-16.3
-2.09%
1 ene 1975 año
712.6
-51.4
-6.73%
1 ene 1976 año
773.9
+61.3
8.6%
1 ene 1977 año
775.5
+1.6
0.21%
1 ene 1978 año
603.1
-172.4
-22.23%
1 ene 1979 año
667.1
+64.0
10.61%
1 ene 1980 año
509.2
-157.9
-23.67%
1 ene 1981 año
617.9
+108.7
21.35%
1 ene 1982 año
451.1
-166.8
-26.99%
1 ene 1983 año
450.6
-0.5
-0.11%
1 ene 1984 año
484.6
+34.0
7.55%
1 ene 1985 año
466.0
-18.6
-3.84%
1 ene 1986 año
449.1
-16.9
-3.63%
1 ene 1987 año
379.8
-69.3
-15.43%
1 ene 1988 año
381.2
+1.4
0.37%
1 ene 1989 año
332.4
-48.8
-12.8%
1 ene 1990 año
277.4
-55.0
-16.55%
1 ene 1991 año
320.9
+43.5
15.68%
1 ene 1992 año
417.5
+96.6
30.1%
1 ene 1993 año
397.1
-20.4
-4.89%
1 ene 1994 año
268.0
-129.1
-32.51%
1 ene 1995 año
298.4
+30.4
11.34%
1 ene 1996 año
401.5
+103.1
34.55%
1 ene 1997 año
653.1
+251.6
62.67%
1 ene 1998 año
567.3
-85.8
-13.14%
1 ene 1999 año
701.6
+134.3
23.67%
1 ene 2000 año
620.4
-81.2
-11.57%
1 ene 2001 año
564.4
-56.0
-9.03%
1 ene 2002 año
585.4
+21.0
3.72%
1 ene 2003 año
627.2
+41.8
7.14%
1 ene 2004 año
646.1
+18.9
3.01%
1 ene 2005 año
491.7
-154.4
-23.9%
1 ene 2006 año
583.4
+91.7
18.65%
1 ene 2007 año
445.9
-137.5
-23.57%
1 ene 2008 año
464.3
+18.4
4.13%
1 ene 2009 año
652.7
+188.4
40.58%
1 ene 2010 año
571.4
-81.3
-12.46%
1 ene 2011 año
629.3
+57.9
10.13%
1 ene 2012 año
662.4
+33.1
5.26%
1 ene 2013 año
552.0
-110.4
-16.67%
1 ene 2014 año
814.4
+262.4
47.54%
1 ene 2015 año
888.3
+73.9
9.07%
Ranking de los países por los datos estadísticos actuales


Comentarios: