29
/es/
es
AIzaSyAYiBZKx7MnpbEhh9jyipgxe19OcubqV5w
April 1, 2024
198809
Mongolia
MNG
true
2
1
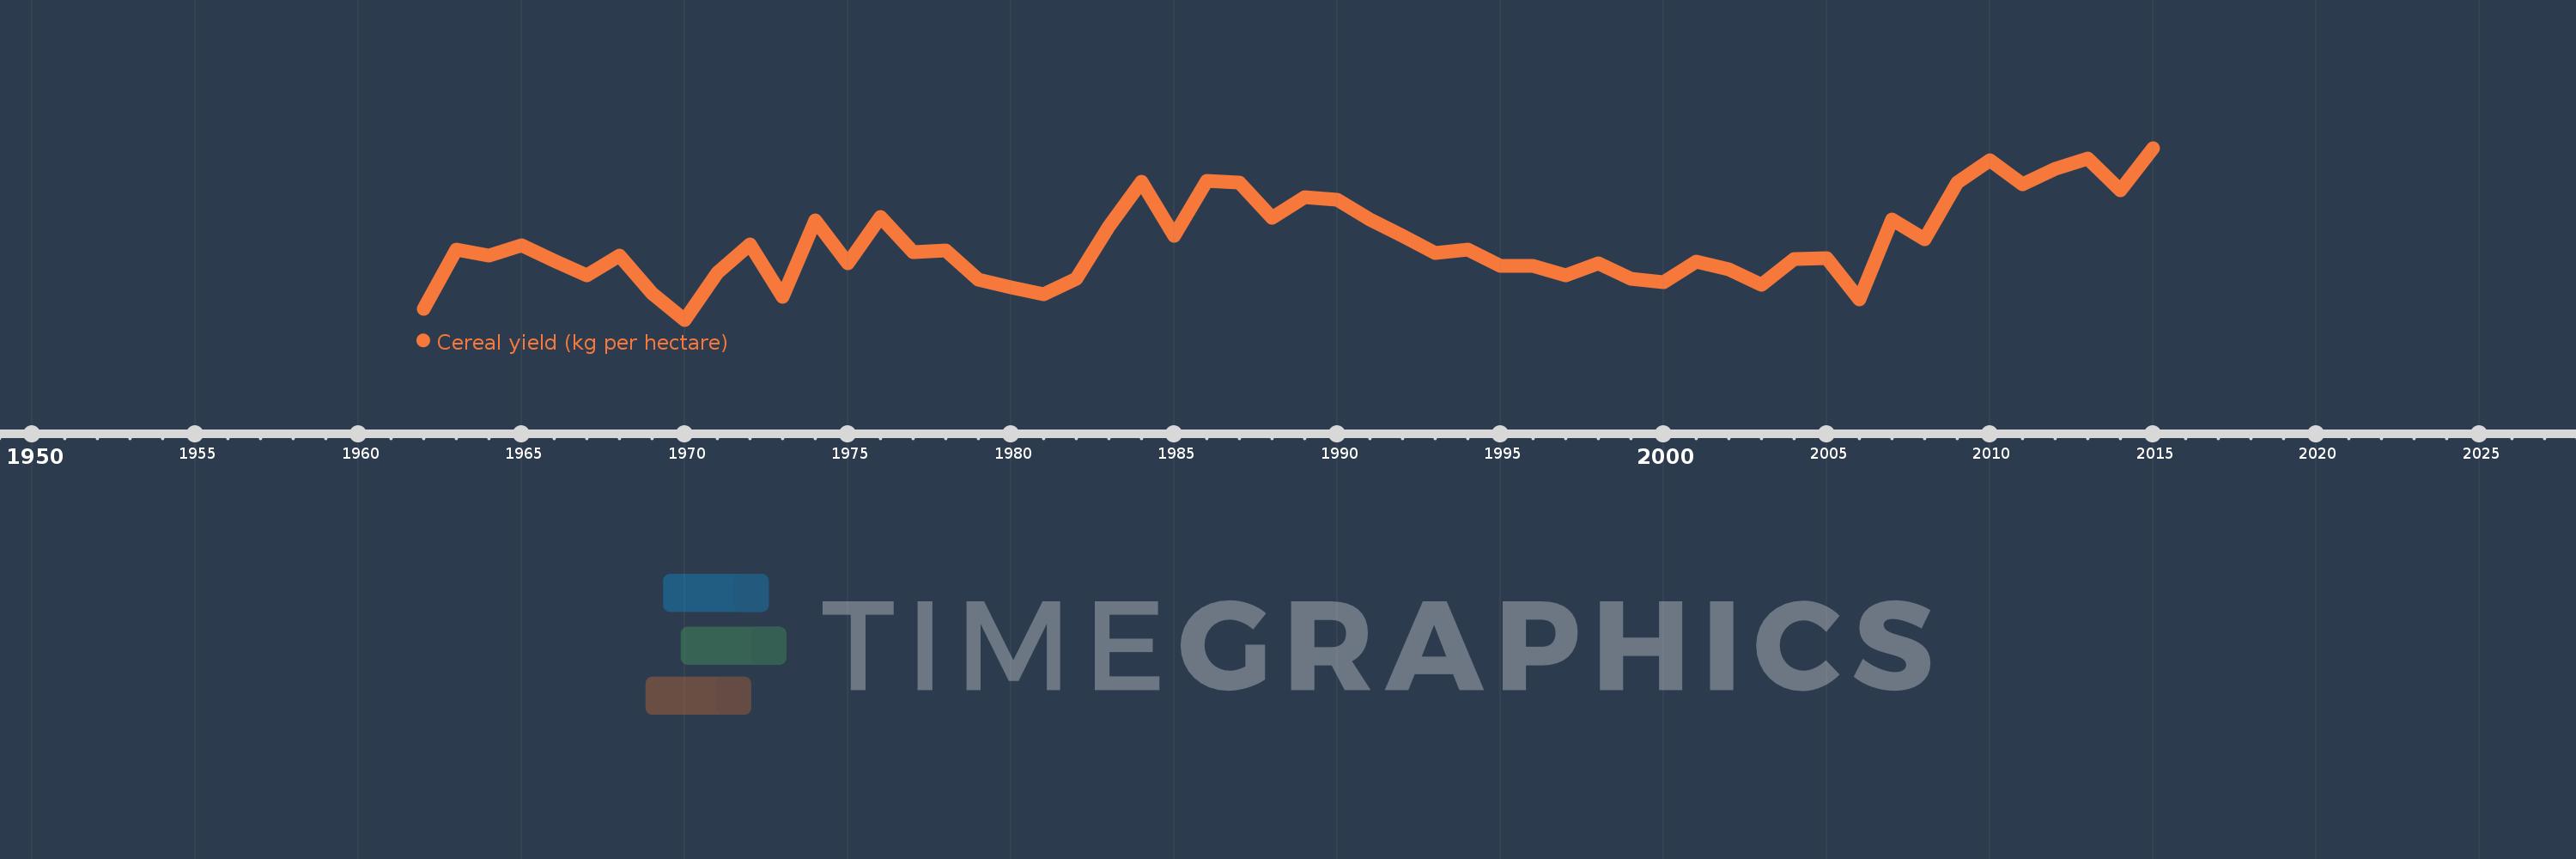
Cereal yield (kg per hectare)
2015,2014,2013,2012,2011,2010,2009,2008,2007,2006,2005,2004,2003,2002,2001,2000,1999,1998,1997,1996,1995,1994,1993,1992,1991,1990,1989,1988,1987,1986,1985,1984,1983,1982,1981,1980,1979,1978,1977,1976,1975,1974,1973,1972,1971,1970,1969,1968,1967,1966,1965,1964,1963,1962
Estas estadísticas en otros países:
AfghanistanAlbaniaAlgeriaAngolaAntigua and BarbudaArab WorldArgentinaArmeniaAustraliaAustriaAzerbaijanBahamas, TheBangladeshBarbadosBelarusBelgiumBelizeBeninBhutanBoliviaBosnia and HerzegovinaBotswanaBrazilBrunei DarussalamBulgariaBurkina FasoBurundiCabo VerdeCambodiaCameroonCanadaCaribbean small statesCentral African RepublicCentral Europe and the BalticsChadChileChinaColombiaComorosCongo, Dem. Rep.Congo, Rep.Costa RicaCote d'IvoireCroatiaCubaCyprusCzech RepublicDenmarkDjiboutiDominicaDominican RepublicEarly-demographic dividendEast Asia & PacificEast Asia & Pacific (excluding high income)East Asia & Pacific (IDA & IBRD countries)EcuadorEgypt, Arab Rep.El SalvadorEritreaEstoniaEthiopiaEuro areaEurope & Central AsiaEurope & Central Asia (excluding high income)Europe & Central Asia (IDA & IBRD countries)European UnionFijiFinlandFragile and conflict affected situationsFranceGabonGambia, TheGeorgiaGermanyGhanaGreeceGrenadaGuamGuatemalaGuineaGuinea-BissauGuyanaHaitiHeavily indebted poor countries (HIPC)High incomeHondurasHong Kong SAR, ChinaHungaryIBRD onlyIDA & IBRD totalIDA blendIDA onlyIDA totalIndiaIndonesiaIran, Islamic Rep.IraqIrelandIsraelItalyJamaicaJapanJordanKazakhstanKenyaKorea, Dem. People’s Rep.Korea, Rep.KuwaitKyrgyz RepublicLao PDRLate-demographic dividendLatin America & Caribbean Latin America & Caribbean (excluding high income)Latin America & the Caribbean (IDA & IBRD countries)LatviaLeast developed countries: UN classificationLebanonLesothoLiberiaLibyaLithuaniaLow & middle incomeLow incomeLower middle incomeLuxembourgMacedonia, FYRMadagascarMalawiMalaysiaMaldivesMaliMaltaMauritaniaMauritiusMexicoMicronesia, Fed. Sts.Middle East & North AfricaMiddle East & North Africa (excluding high income)Middle East & North Africa (IDA & IBRD countries)Middle incomeMoldovaMongoliaMontenegroMoroccoMozambiqueMyanmarNamibiaNepalNetherlandsNew CaledoniaNew ZealandNicaraguaNigerNigeriaNorth AmericaNorwayOECD membersOmanOther small statesPacific island small statesPakistanPanamaPapua New GuineaParaguayPeruPhilippinesPolandPortugalPost-demographic dividendPre-demographic dividendPuerto RicoQatarRomaniaRussian FederationRwandaSao Tome and PrincipeSaudi ArabiaSenegalSerbiaSierra LeoneSlovak RepublicSloveniaSmall statesSolomon IslandsSomaliaSouth AfricaSouth AsiaSouth Asia (IDA & IBRD)South SudanSpainSri LankaSt. LuciaSt. Vincent and the GrenadinesSub-Saharan Africa Sub-Saharan Africa (excluding high income)Sub-Saharan Africa (IDA & IBRD countries)SudanSurinameSwazilandSwedenSwitzerlandSyrian Arab RepublicTajikistanTanzaniaThailandTimor-LesteTogoTrinidad and TobagoTunisiaTurkeyTurkmenistanUgandaUkraineUnited Arab EmiratesUnited KingdomUnited StatesUpper middle incomeUruguayUzbekistanVanuatuVenezuela, RBVietnamWest Bank and GazaWorldYemen, Rep.ZambiaZimbabwe línea de tiempo (timeline):
En esta escala de tiempo se presenta un gráfico de 1962 y 2015 de Mongolia. Los datos de 1961 están ausentes. El número de observaciones reales por fecha: 54.
Fuente (nombre):
Indicadores del desarrollo mundial
Fuente (organización):
Food and Agriculture Organization, electronic files and web site.
Categorías:
Agriculture & Rural Development, Climate Change
Se ha actualizado:
23 abr 2017 año
Los indicadores de los cambios de valor en los últimos años
Mínimo:
317.9
1 ene 1970 año
Máximo:
1.65 mil
1 ene 2015 año
A la fecha de observación
Valor
Cambio absoluto
El cambio con respecto al valor anterior
1 ene 1962 año
400.0
+400.0
0.0%
1 ene 1963 año
861.6
+461.6
115.4%
1 ene 1964 año
817.8
-43.8
-5.08%
1 ene 1965 año
898.3
+80.5
9.84%
1 ene 1966 año
772.8
-125.5
-13.97%
1 ene 1967 año
662.5
-110.3
-14.27%
1 ene 1968 año
816.2
+153.7
23.2%
1 ene 1969 año
525.7
-290.5
-35.59%
1 ene 1970 año
317.9
-207.8
-39.53%
1 ene 1971 año
681.2
+363.3
114.28%
1 ene 1972 año
899.0
+217.8
31.97%
1 ene 1973 año
497.2
-401.8
-44.69%
1 ene 1974 año
1.085 mil
+588.1
118.28%
1 ene 1975 año
752.8
-332.5
-30.64%
1 ene 1976 año
1.114 mil
+361.0
47.95%
1 ene 1977 año
841.8
-272.0
-24.42%
1 ene 1978 año
855.3
+13.5
1.6%
1 ene 1979 año
626.9
-228.4
-26.7%
1 ene 1980 año
566.2
-60.7
-9.68%
1 ene 1981 año
517.0
-49.2
-8.69%
1 ene 1982 año
635.1
+118.1
22.84%
1 ene 1983 año
1.043 mil
+407.5
64.16%
1 ene 1984 año
1.387 mil
+344.9
33.08%
1 ene 1985 año
966.3
-421.2
-30.36%
1 ene 1986 año
1.396 mil
+429.3
44.43%
1 ene 1987 año
1.381 mil
-15.0
-1.07%
1 ene 1988 año
1.107 mil
-274.0
-19.85%
1 ene 1989 año
1.269 mil
+162.5
14.68%
1 ene 1990 año
1.248 mil
-20.8
-1.64%
1 ene 1991 año
1.098 mil
-150.1
-12.02%
1 ene 1992 año
970.3
-127.9
-11.65%
1 ene 1993 año
833.4
-136.9
-14.11%
1 ene 1994 año
864.1
+30.7
3.68%
1 ene 1995 año
735.4
-128.7
-14.89%
1 ene 1996 año
735.2
-0.2
-0.03%
1 ene 1997 año
660.7
-74.5
-10.13%
1 ene 1998 año
757.1
+96.4
14.59%
1 ene 1999 año
634.1
-123.0
-16.25%
1 ene 2000 año
606.5
-27.6
-4.35%
1 ene 2001 año
771.4
+164.9
27.19%
1 ene 2002 año
709.9
-61.5
-7.97%
1 ene 2003 año
586.8
-123.1
-17.34%
1 ene 2004 año
791.4
+204.6
34.87%
1 ene 2005 año
796.0
+4.6
0.58%
1 ene 2006 año
478.8
-317.2
-39.85%
1 ene 2007 año
1.098 mil
+619.2
129.32%
1 ene 2008 año
942.5
-155.5
-14.16%
1 ene 2009 año
1.383 mil
+440.3
46.72%
1 ene 2010 año
1.552 mil
+169.0
12.22%
1 ene 2011 año
1.37 mil
-181.7
-11.71%
1 ene 2012 año
1.485 mil
+115.3
8.42%
1 ene 2013 año
1.565 mil
+79.9
5.38%
1 ene 2014 año
1.32 mil
-245.5
-15.68%
1 ene 2015 año
1.65 mil
+330.2
25.02%
Ranking de los países por los datos estadísticos actuales


Comentarios: