29
/es/
es
AIzaSyAYiBZKx7MnpbEhh9jyipgxe19OcubqV5w
April 1, 2024
102200
Central African Republic
CAF
true
2
1
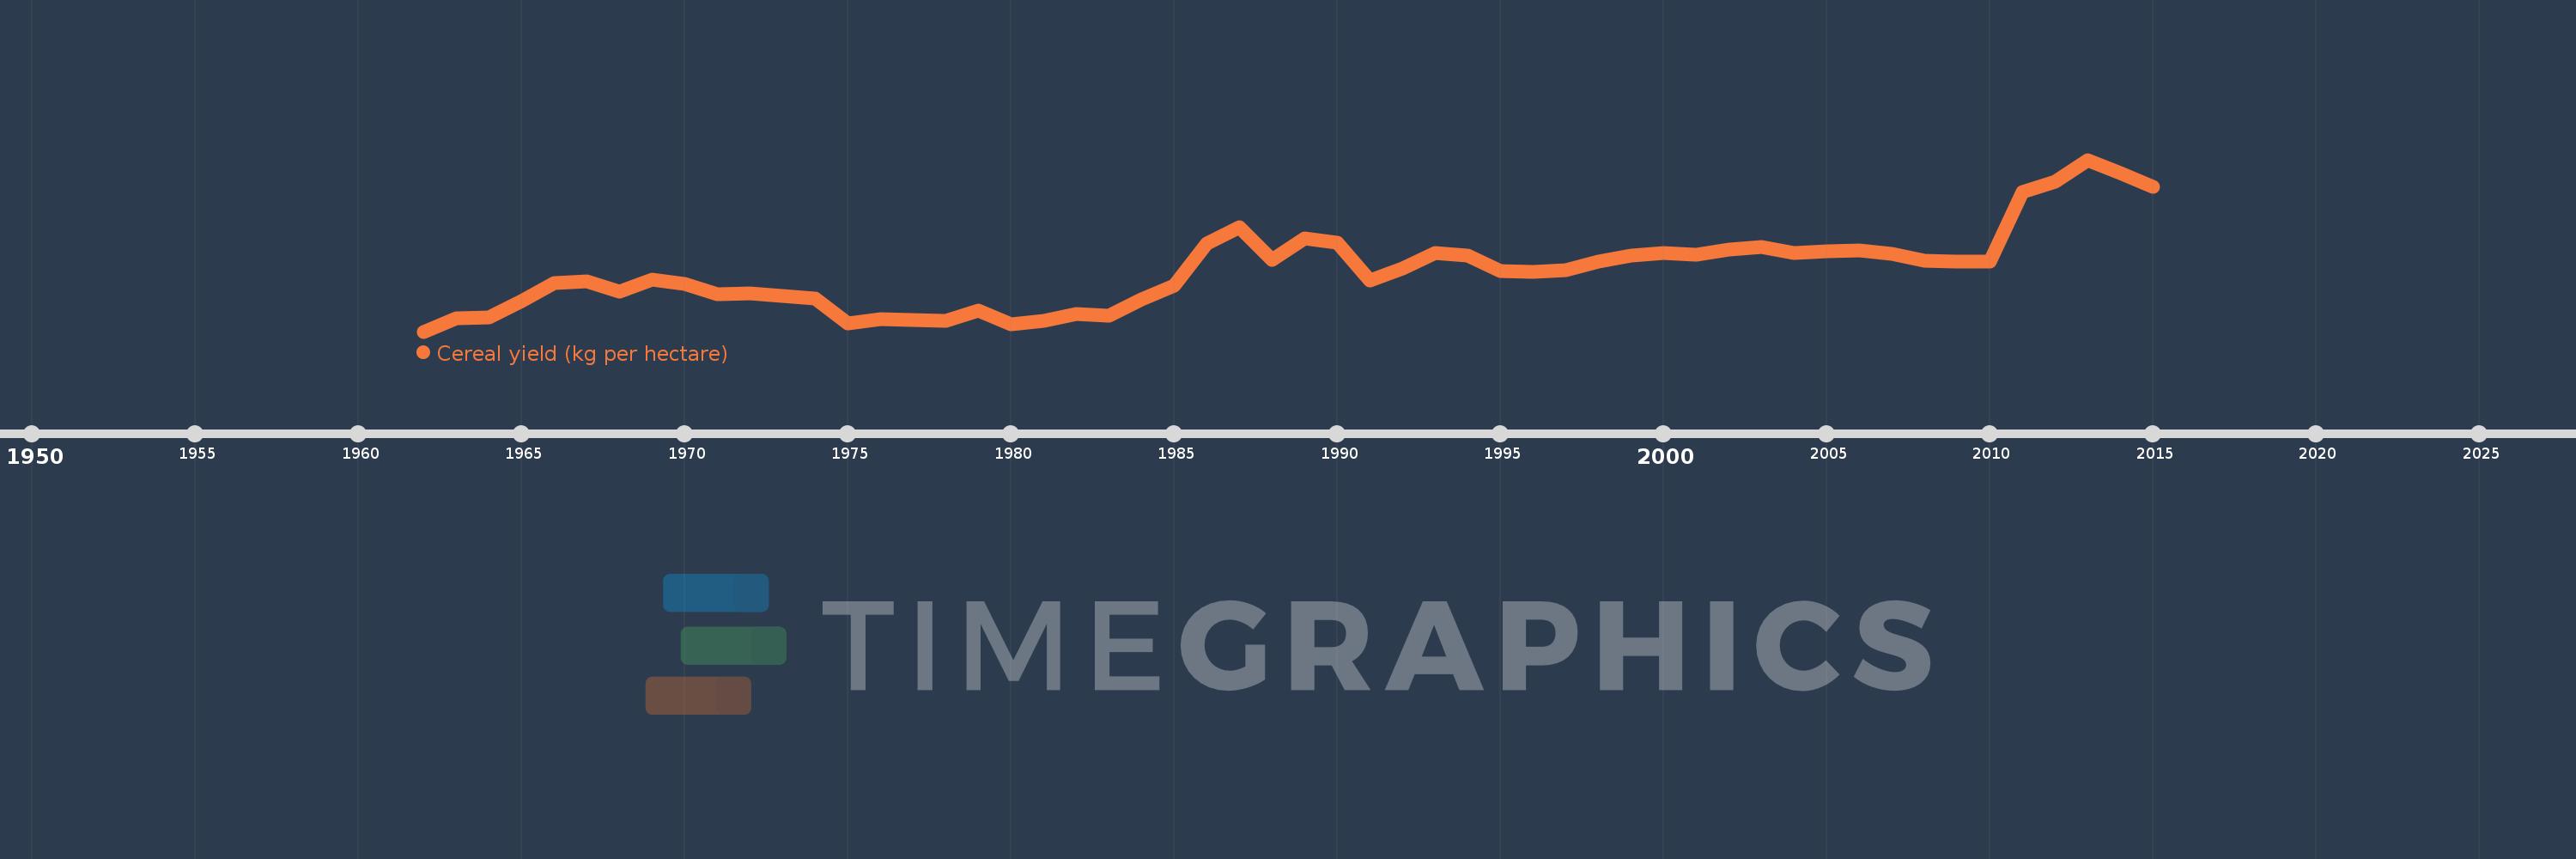
Cereal yield (kg per hectare)
2015,2014,2013,2012,2011,2010,2009,2008,2007,2006,2005,2004,2003,2002,2001,2000,1999,1998,1997,1996,1995,1994,1993,1992,1991,1990,1989,1988,1987,1986,1985,1984,1983,1982,1981,1980,1979,1978,1977,1976,1975,1974,1973,1972,1971,1970,1969,1968,1967,1966,1965,1964,1963,1962
Estas estadísticas en otros países:
AfghanistanAlbaniaAlgeriaAngolaAntigua and BarbudaArab WorldArgentinaArmeniaAustraliaAustriaAzerbaijanBahamas, TheBangladeshBarbadosBelarusBelgiumBelizeBeninBhutanBoliviaBosnia and HerzegovinaBotswanaBrazilBrunei DarussalamBulgariaBurkina FasoBurundiCabo VerdeCambodiaCameroonCanadaCaribbean small statesCentral African RepublicCentral Europe and the BalticsChadChileChinaColombiaComorosCongo, Dem. Rep.Congo, Rep.Costa RicaCote d'IvoireCroatiaCubaCyprusCzech RepublicDenmarkDjiboutiDominicaDominican RepublicEarly-demographic dividendEast Asia & PacificEast Asia & Pacific (excluding high income)East Asia & Pacific (IDA & IBRD countries)EcuadorEgypt, Arab Rep.El SalvadorEritreaEstoniaEthiopiaEuro areaEurope & Central AsiaEurope & Central Asia (excluding high income)Europe & Central Asia (IDA & IBRD countries)European UnionFijiFinlandFragile and conflict affected situationsFranceGabonGambia, TheGeorgiaGermanyGhanaGreeceGrenadaGuamGuatemalaGuineaGuinea-BissauGuyanaHaitiHeavily indebted poor countries (HIPC)High incomeHondurasHong Kong SAR, ChinaHungaryIBRD onlyIDA & IBRD totalIDA blendIDA onlyIDA totalIndiaIndonesiaIran, Islamic Rep.IraqIrelandIsraelItalyJamaicaJapanJordanKazakhstanKenyaKorea, Dem. People’s Rep.Korea, Rep.KuwaitKyrgyz RepublicLao PDRLate-demographic dividendLatin America & Caribbean Latin America & Caribbean (excluding high income)Latin America & the Caribbean (IDA & IBRD countries)LatviaLeast developed countries: UN classificationLebanonLesothoLiberiaLibyaLithuaniaLow & middle incomeLow incomeLower middle incomeLuxembourgMacedonia, FYRMadagascarMalawiMalaysiaMaldivesMaliMaltaMauritaniaMauritiusMexicoMicronesia, Fed. Sts.Middle East & North AfricaMiddle East & North Africa (excluding high income)Middle East & North Africa (IDA & IBRD countries)Middle incomeMoldovaMongoliaMontenegroMoroccoMozambiqueMyanmarNamibiaNepalNetherlandsNew CaledoniaNew ZealandNicaraguaNigerNigeriaNorth AmericaNorwayOECD membersOmanOther small statesPacific island small statesPakistanPanamaPapua New GuineaParaguayPeruPhilippinesPolandPortugalPost-demographic dividendPre-demographic dividendPuerto RicoQatarRomaniaRussian FederationRwandaSao Tome and PrincipeSaudi ArabiaSenegalSerbiaSierra LeoneSlovak RepublicSloveniaSmall statesSolomon IslandsSomaliaSouth AfricaSouth AsiaSouth Asia (IDA & IBRD)South SudanSpainSri LankaSt. LuciaSt. Vincent and the GrenadinesSub-Saharan Africa Sub-Saharan Africa (excluding high income)Sub-Saharan Africa (IDA & IBRD countries)SudanSurinameSwazilandSwedenSwitzerlandSyrian Arab RepublicTajikistanTanzaniaThailandTimor-LesteTogoTrinidad and TobagoTunisiaTurkeyTurkmenistanUgandaUkraineUnited Arab EmiratesUnited KingdomUnited StatesUpper middle incomeUruguayUzbekistanVanuatuVenezuela, RBVietnamWest Bank and GazaWorldYemen, Rep.ZambiaZimbabwe línea de tiempo (timeline):
En esta escala de tiempo se presenta un gráfico de 1962 y 2015 de Central African Republic. Los datos de 1961 están ausentes. El número de observaciones reales por fecha: 54.
Fuente (nombre):
Indicadores del desarrollo mundial
Fuente (organización):
Food and Agriculture Organization, electronic files and web site.
Categorías:
Agriculture & Rural Development, Climate Change
Se ha actualizado:
23 abr 2017 año
Los indicadores de los cambios de valor en los últimos años
Mínimo:
443.0
1 ene 1962 año
Máximo:
1.676 mil
1 ene 2013 año
A la fecha de observación
Valor
Cambio absoluto
El cambio con respecto al valor anterior
1 ene 1962 año
443.0
+443.0
0.0%
1 ene 1963 año
540.9
+97.9
22.1%
1 ene 1964 año
543.9
+3.0
0.55%
1 ene 1965 año
661.6
+117.7
21.64%
1 ene 1966 año
790.2
+128.6
19.44%
1 ene 1967 año
806.6
+16.4
2.08%
1 ene 1968 año
728.5
-78.1
-9.68%
1 ene 1969 año
814.0
+85.5
11.74%
1 ene 1970 año
783.3
-30.7
-3.77%
1 ene 1971 año
712.4
-70.9
-9.05%
1 ene 1972 año
717.9
+5.5
0.77%
1 ene 1973 año
696.2
-21.7
-3.02%
1 ene 1974 año
682.8
-13.4
-1.92%
1 ene 1975 año
502.6
-180.2
-26.39%
1 ene 1976 año
533.5
+30.9
6.15%
1 ene 1977 año
526.0
-7.5
-1.41%
1 ene 1978 año
522.5
-3.5
-0.67%
1 ene 1979 año
595.4
+72.9
13.95%
1 ene 1980 año
497.2
-98.2
-16.49%
1 ene 1981 año
521.0
+23.8
4.79%
1 ene 1982 año
569.6
+48.6
9.33%
1 ene 1983 año
559.3
-10.3
-1.81%
1 ene 1984 año
674.6
+115.3
20.62%
1 ene 1985 año
772.1
+97.5
14.45%
1 ene 1986 año
1.077 mil
+304.8
39.48%
1 ene 1987 año
1.189 mil
+112.4
10.44%
1 ene 1988 año
958.4
-230.9
-19.41%
1 ene 1989 año
1.112 mil
+153.9
16.06%
1 ene 1990 año
1.079 mil
-33.7
-3.03%
1 ene 1991 año
809.9
-268.7
-24.91%
1 ene 1992 año
893.5
+83.6
10.32%
1 ene 1993 año
1.006 mil
+112.6
12.6%
1 ene 1994 año
990.0
-16.1
-1.6%
1 ene 1995 año
876.6
-113.4
-11.45%
1 ene 1996 año
869.5
-7.1
-0.81%
1 ene 1997 año
882.9
+13.4
1.54%
1 ene 1998 año
947.9
+65.0
7.36%
1 ene 1999 año
985.7
+37.8
3.99%
1 ene 2000 año
1.007 mil
+21.2
2.15%
1 ene 2001 año
993.4
-13.5
-1.34%
1 ene 2002 año
1.033 mil
+39.3
3.96%
1 ene 2003 año
1.048 mil
+15.6
1.51%
1 ene 2004 año
1.01 mil
-38.7
-3.69%
1 ene 2005 año
1.019 mil
+9.0
0.89%
1 ene 2006 año
1.023 mil
+4.6
0.45%
1 ene 2007 año
999.7
-23.5
-2.3%
1 ene 2008 año
951.2
-48.5
-4.85%
1 ene 2009 año
946.8
-4.4
-0.46%
1 ene 2010 año
948.4
+1.6
0.17%
1 ene 2011 año
1.447 mil
+499.0
52.61%
1 ene 2012 año
1.516 mil
+68.8
4.75%
1 ene 2013 año
1.676 mil
+160.2
10.57%
1 ene 2014 año
1.582 mil
-94.3
-5.63%
1 ene 2015 año
1.48 mil
-102.6
-6.49%
Ranking de los países por los datos estadísticos actuales


Comentarios: