29
/es/
es
AIzaSyAYiBZKx7MnpbEhh9jyipgxe19OcubqV5w
April 1, 2024
258066
Syrian Arab Republic
SYR
true
2
1
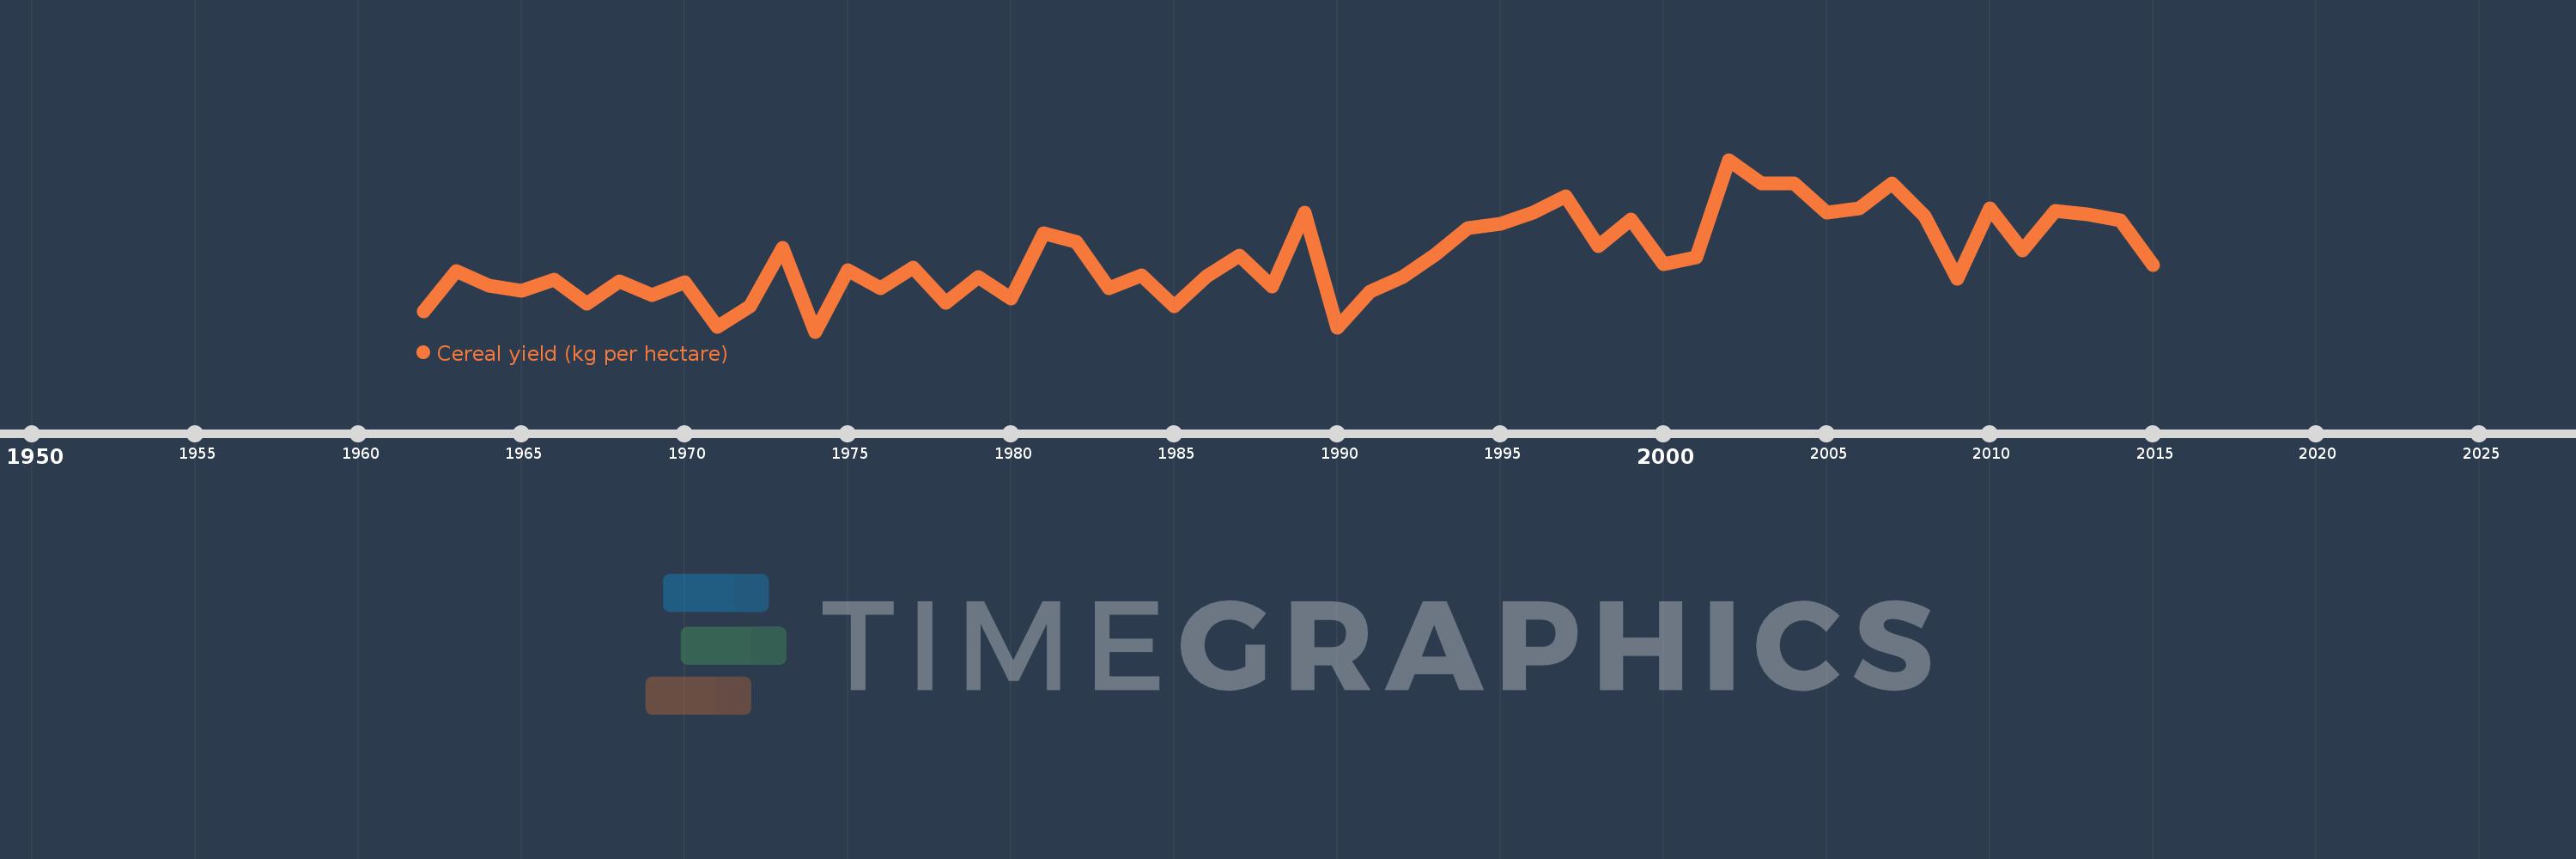
Cereal yield (kg per hectare)
2015,2014,2013,2012,2011,2010,2009,2008,2007,2006,2005,2004,2003,2002,2001,2000,1999,1998,1997,1996,1995,1994,1993,1992,1991,1990,1989,1988,1987,1986,1985,1984,1983,1982,1981,1980,1979,1978,1977,1976,1975,1974,1973,1972,1971,1970,1969,1968,1967,1966,1965,1964,1963,1962
Estas estadísticas en otros países:
AfghanistanAlbaniaAlgeriaAngolaAntigua and BarbudaArab WorldArgentinaArmeniaAustraliaAustriaAzerbaijanBahamas, TheBangladeshBarbadosBelarusBelgiumBelizeBeninBhutanBoliviaBosnia and HerzegovinaBotswanaBrazilBrunei DarussalamBulgariaBurkina FasoBurundiCabo VerdeCambodiaCameroonCanadaCaribbean small statesCentral African RepublicCentral Europe and the BalticsChadChileChinaColombiaComorosCongo, Dem. Rep.Congo, Rep.Costa RicaCote d'IvoireCroatiaCubaCyprusCzech RepublicDenmarkDjiboutiDominicaDominican RepublicEarly-demographic dividendEast Asia & PacificEast Asia & Pacific (excluding high income)East Asia & Pacific (IDA & IBRD countries)EcuadorEgypt, Arab Rep.El SalvadorEritreaEstoniaEthiopiaEuro areaEurope & Central AsiaEurope & Central Asia (excluding high income)Europe & Central Asia (IDA & IBRD countries)European UnionFijiFinlandFragile and conflict affected situationsFranceGabonGambia, TheGeorgiaGermanyGhanaGreeceGrenadaGuamGuatemalaGuineaGuinea-BissauGuyanaHaitiHeavily indebted poor countries (HIPC)High incomeHondurasHong Kong SAR, ChinaHungaryIBRD onlyIDA & IBRD totalIDA blendIDA onlyIDA totalIndiaIndonesiaIran, Islamic Rep.IraqIrelandIsraelItalyJamaicaJapanJordanKazakhstanKenyaKorea, Dem. People’s Rep.Korea, Rep.KuwaitKyrgyz RepublicLao PDRLate-demographic dividendLatin America & Caribbean Latin America & Caribbean (excluding high income)Latin America & the Caribbean (IDA & IBRD countries)LatviaLeast developed countries: UN classificationLebanonLesothoLiberiaLibyaLithuaniaLow & middle incomeLow incomeLower middle incomeLuxembourgMacedonia, FYRMadagascarMalawiMalaysiaMaldivesMaliMaltaMauritaniaMauritiusMexicoMicronesia, Fed. Sts.Middle East & North AfricaMiddle East & North Africa (excluding high income)Middle East & North Africa (IDA & IBRD countries)Middle incomeMoldovaMongoliaMontenegroMoroccoMozambiqueMyanmarNamibiaNepalNetherlandsNew CaledoniaNew ZealandNicaraguaNigerNigeriaNorth AmericaNorwayOECD membersOmanOther small statesPacific island small statesPakistanPanamaPapua New GuineaParaguayPeruPhilippinesPolandPortugalPost-demographic dividendPre-demographic dividendPuerto RicoQatarRomaniaRussian FederationRwandaSao Tome and PrincipeSaudi ArabiaSenegalSerbiaSierra LeoneSlovak RepublicSloveniaSmall statesSolomon IslandsSomaliaSouth AfricaSouth AsiaSouth Asia (IDA & IBRD)South SudanSpainSri LankaSt. LuciaSt. Vincent and the GrenadinesSub-Saharan Africa Sub-Saharan Africa (excluding high income)Sub-Saharan Africa (IDA & IBRD countries)SudanSurinameSwazilandSwedenSwitzerlandSyrian Arab RepublicTajikistanTanzaniaThailandTimor-LesteTogoTrinidad and TobagoTunisiaTurkeyTurkmenistanUgandaUkraineUnited Arab EmiratesUnited KingdomUnited StatesUpper middle incomeUruguayUzbekistanVanuatuVenezuela, RBVietnamWest Bank and GazaWorldYemen, Rep.ZambiaZimbabwe línea de tiempo (timeline):
En esta escala de tiempo se presenta un gráfico de 1962 y 2015 de Syrian Arab Republic. Los datos de 1961 están ausentes. El número de observaciones reales por fecha: 54.
Fuente (nombre):
Indicadores del desarrollo mundial
Fuente (organización):
Food and Agriculture Organization, electronic files and web site.
Categorías:
Agriculture & Rural Development, Climate Change
Se ha actualizado:
23 abr 2017 año
Los indicadores de los cambios de valor en los últimos años
Mínimo:
293.8
1 ene 1974 año
Máximo:
2.27 mil
1 ene 2002 año
A la fecha de observación
Valor
Cambio absoluto
El cambio con respecto al valor anterior
1 ene 1962 año
528.6
+528.6
0.0%
1 ene 1963 año
987.1
+458.5
86.74%
1 ene 1964 año
820.3
-166.8
-16.9%
1 ene 1965 año
762.4
-57.9
-7.06%
1 ene 1966 año
893.9
+131.5
17.25%
1 ene 1967 año
618.4
-275.5
-30.82%
1 ene 1968 año
869.9
+251.5
40.67%
1 ene 1969 año
718.2
-151.7
-17.44%
1 ene 1970 año
861.9
+143.7
20.01%
1 ene 1971 año
346.5
-515.4
-59.8%
1 ene 1972 año
588.7
+242.2
69.9%
1 ene 1973 año
1.257 mil
+667.9
113.45%
1 ene 1974 año
293.8
-962.8
-76.62%
1 ene 1975 año
1.002 mil
+708.1
241.01%
1 ene 1976 año
788.2
-213.7
-21.33%
1 ene 1977 año
1.028 mil
+239.5
30.39%
1 ene 1978 año
622.7
-405.0
-39.41%
1 ene 1979 año
921.5
+298.8
47.98%
1 ene 1980 año
673.2
-248.3
-26.95%
1 ene 1981 año
1.42 mil
+747.2
110.99%
1 ene 1982 año
1.33 mil
-90.4
-6.36%
1 ene 1983 año
792.0
-538.0
-40.45%
1 ene 1984 año
936.0
+144.0
18.18%
1 ene 1985 año
584.5
-351.5
-37.55%
1 ene 1986 año
935.1
+350.6
59.98%
1 ene 1987 año
1.167 mil
+231.9
24.8%
1 ene 1988 año
814.7
-352.3
-30.19%
1 ene 1989 año
1.661 mil
+845.9
103.83%
1 ene 1990 año
334.7
-1.326 mil
-79.84%
1 ene 1991 año
750.0
+415.3
124.08%
1 ene 1992 año
922.3
+172.3
22.97%
1 ene 1993 año
1.175 mil
+252.4
27.37%
1 ene 1994 año
1.489 mil
+314.3
26.76%
1 ene 1995 año
1.536 mil
+47.4
3.18%
1 ene 1996 año
1.661 mil
+124.7
8.12%
1 ene 1997 año
1.853 mil
+192.0
11.56%
1 ene 1998 año
1.273 mil
-580.2
-31.31%
1 ene 1999 año
1.585 mil
+311.7
24.49%
1 ene 2000 año
1.072 mil
-512.2
-32.32%
1 ene 2001 año
1.149 mil
+76.2
7.11%
1 ene 2002 año
2.27 mil
+1.121 mil
97.61%
1 ene 2003 año
1.994 mil
-276.2
-12.17%
1 ene 2004 año
1.999 mil
+5.5
0.28%
1 ene 2005 año
1.657 mil
-341.5
-17.08%
1 ene 2006 año
1.711 mil
+53.9
3.25%
1 ene 2007 año
2.002 mil
+290.9
17.0%
1 ene 2008 año
1.622 mil
-379.9
-18.97%
1 ene 2009 año
896.7
-725.7
-44.73%
1 ene 2010 año
1.708 mil
+811.0
90.44%
1 ene 2011 año
1.232 mil
-475.8
-27.86%
1 ene 2012 año
1.679 mil
+447.1
36.29%
1 ene 2013 año
1.643 mil
-35.7
-2.13%
1 ene 2014 año
1.576 mil
-67.3
-4.1%
1 ene 2015 año
1.063 mil
-512.5
-32.52%
Ranking de los países por los datos estadísticos actuales


Comentarios: