29
/es/
es
AIzaSyAYiBZKx7MnpbEhh9jyipgxe19OcubqV5w
April 1, 2024
63739
Afghanistan
AFG
true
2
1
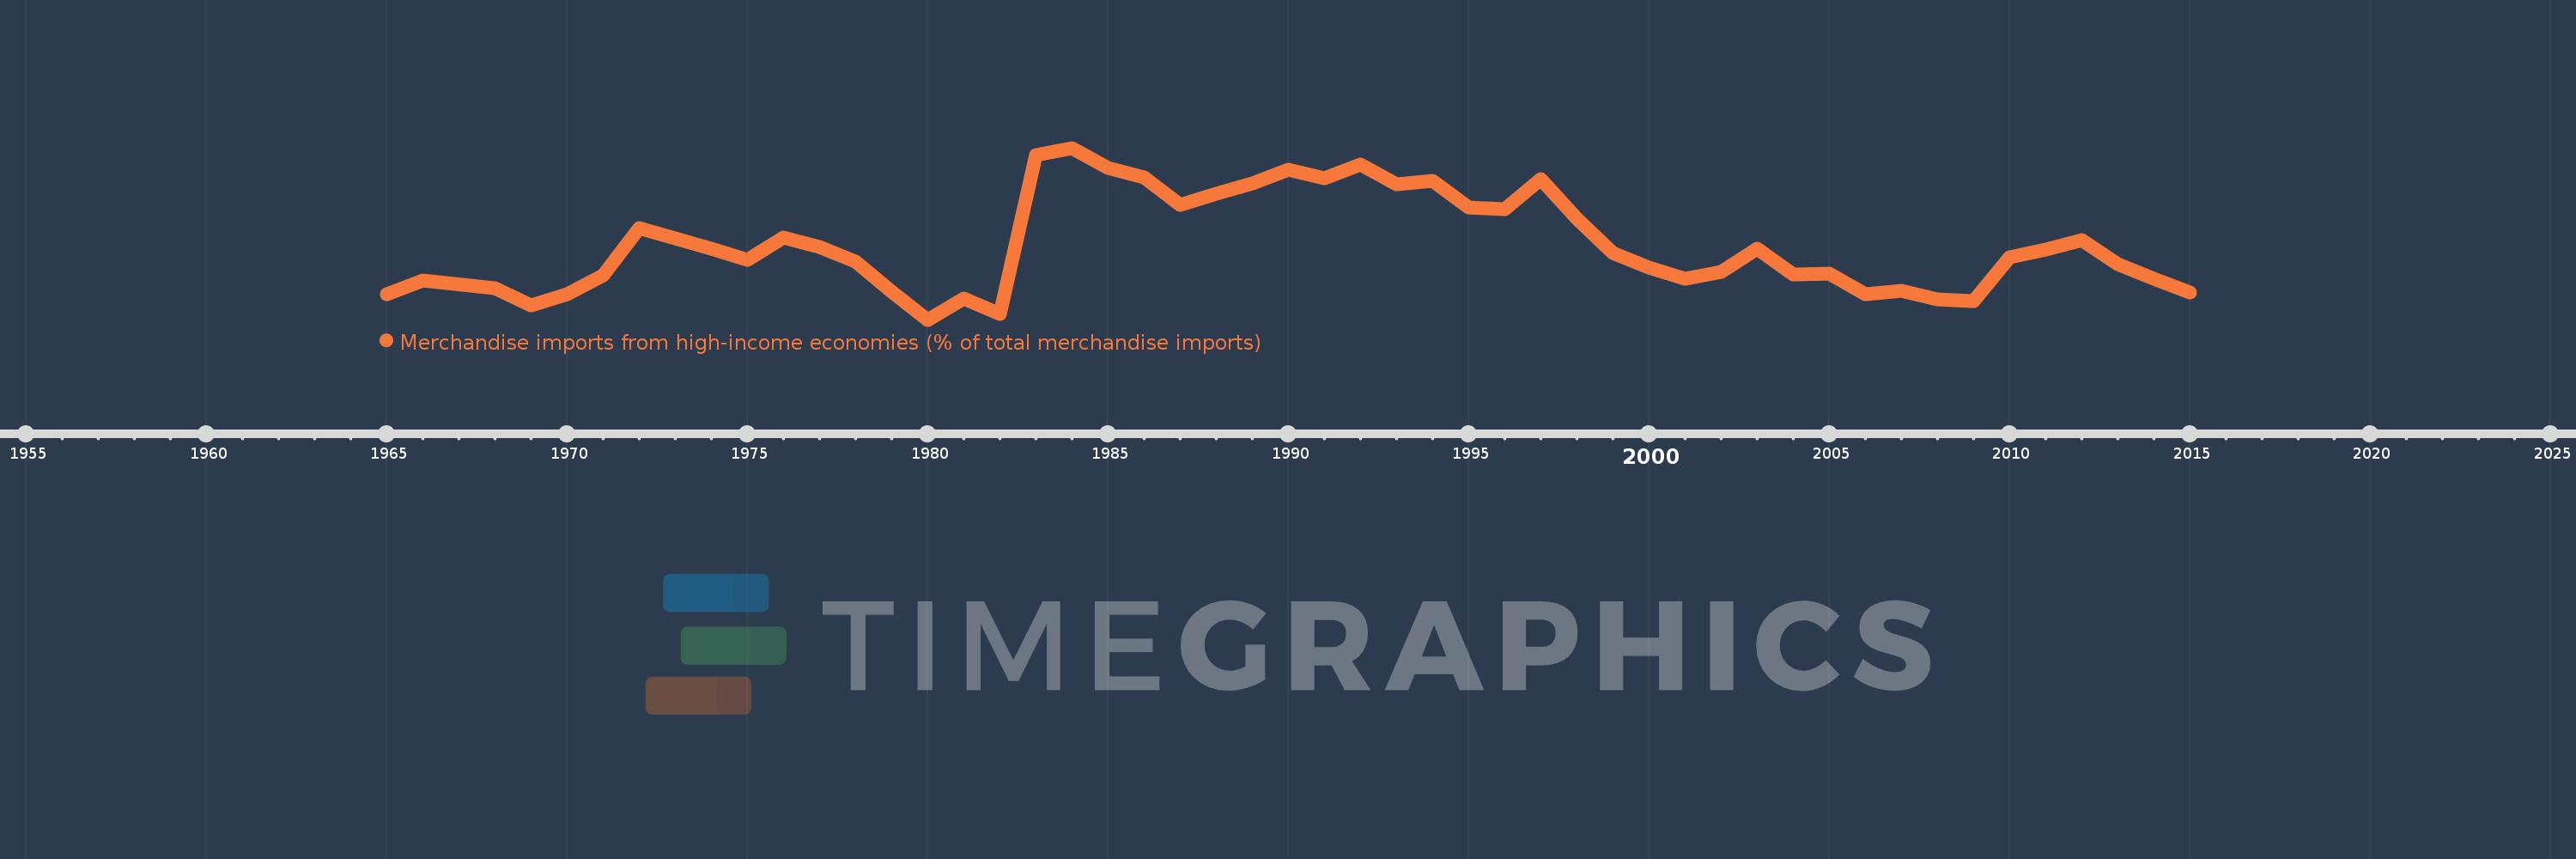
Merchandise imports from high-income economies (% of total merchandise imports)
2015,2014,2013,2012,2011,2010,2009,2008,2007,2006,2005,2004,2003,2002,2001,2000,1999,1998,1997,1996,1995,1994,1993,1992,1991,1990,1989,1988,1987,1986,1985,1984,1983,1982,1981,1980,1979,1978,1977,1976,1975,1974,1972,1971,1970,1969,1968,1966,1965
Estas estadísticas en otros países:
AfghanistanAlbaniaAlgeriaAngolaAntigua and BarbudaArab WorldArgentinaArmeniaArubaAustraliaAustriaAzerbaijanBahamas, TheBahrainBangladeshBarbadosBelarusBelgiumBelizeBeninBermudaBoliviaBosnia and HerzegovinaBrazilBrunei DarussalamBulgariaBurkina FasoBurundiCabo VerdeCambodiaCameroonCanadaCaribbean small statesCentral African RepublicCentral Europe and the BalticsChadChileChinaColombiaComorosCongo, Dem. Rep.Congo, Rep.Costa RicaCote d'IvoireCroatiaCubaCyprusCzech RepublicDenmarkDjiboutiDominicaDominican RepublicEarly-demographic dividendEast Asia & PacificEast Asia & Pacific (excluding high income)East Asia & Pacific (IDA & IBRD countries)EcuadorEgypt, Arab Rep.El SalvadorEquatorial GuineaEstoniaEthiopiaEuro areaEurope & Central AsiaEurope & Central Asia (excluding high income)Europe & Central Asia (IDA & IBRD countries)European UnionFaroe IslandsFijiFinlandFragile and conflict affected situationsFranceFrench PolynesiaGabonGambia, TheGeorgiaGermanyGhanaGibraltarGreeceGreenlandGrenadaGuamGuatemalaGuineaGuinea-BissauGuyanaHaitiHeavily indebted poor countries (HIPC)High incomeHondurasHong Kong SAR, ChinaHungaryIBRD onlyIcelandIDA & IBRD totalIDA blendIDA onlyIDA totalIndiaIndonesiaIran, Islamic Rep.IraqIrelandIsraelItalyJamaicaJapanJordanKazakhstanKenyaKiribatiKorea, Dem. People’s Rep.Korea, Rep.KosovoKuwaitKyrgyz RepublicLao PDRLate-demographic dividendLatin America & Caribbean Latin America & Caribbean (excluding high income)Latin America & the Caribbean (IDA & IBRD countries)LatviaLeast developed countries: UN classificationLebanonLiberiaLibyaLithuaniaLow & middle incomeLow incomeLower middle incomeLuxembourgMacao SAR, ChinaMacedonia, FYRMadagascarMalawiMalaysiaMaldivesMaliMaltaMauritaniaMauritiusMexicoMiddle East & North AfricaMiddle East & North Africa (excluding high income)Middle East & North Africa (IDA & IBRD countries)Middle incomeMoldovaMongoliaMontenegroMoroccoMozambiqueMyanmarNauruNepalNetherlandsNew CaledoniaNew ZealandNicaraguaNigerNigeriaNorth AmericaNorwayOECD membersOmanOther small statesPacific island small statesPakistanPanamaPapua New GuineaParaguayPeruPhilippinesPolandPortugalPost-demographic dividendPre-demographic dividendQatarRomaniaRussian FederationRwandaSamoaSao Tome and PrincipeSaudi ArabiaSenegalSerbiaSeychellesSierra LeoneSingaporeSlovak RepublicSloveniaSmall statesSolomon IslandsSomaliaSouth AfricaSouth AsiaSouth Asia (IDA & IBRD)SpainSri LankaSt. Kitts and NevisSt. LuciaSt. Vincent and the GrenadinesSub-Saharan Africa Sub-Saharan Africa (excluding high income)Sub-Saharan Africa (IDA & IBRD countries)SudanSurinameSwedenSwitzerlandSyrian Arab RepublicTajikistanTanzaniaThailandTogoTongaTrinidad and TobagoTunisiaTurkeyTurkmenistanTuvaluUgandaUkraineUnited Arab EmiratesUnited KingdomUnited StatesUpper middle incomeUruguayUzbekistanVanuatuVenezuela, RBVietnamWorldYemen, Rep.ZambiaZimbabwe línea de tiempo (timeline):
En esta escala de tiempo se presenta un gráfico de 1965 y 2015 de Afghanistan. Los datos de 1964 están ausentes. El número de observaciones reales por fecha: 49.
Fuente (nombre):
Indicadores del desarrollo mundial
Fuente (organización):
World Bank staff estimates based data from International Monetary Fund's Direction of Trade database.
Categorías:
Private Sector, Trade
Se ha actualizado:
23 abr 2017 año
Los indicadores de los cambios de valor en los últimos años
Mínimo:
24.562
1 ene 1980 año
Máximo:
85.846
1 ene 1984 año
A la fecha de observación
Valor
Cambio absoluto
El cambio con respecto al valor anterior
1 ene 1965 año
33.689
+33.689
0.0%
1 ene 1966 año
38.67
+4.98
14.78%
1 ene 1968 año
35.84
-2.83
-7.32%
1 ene 1969 año
29.702
-6.137
-17.12%
1 ene 1970 año
33.707
+4.004
13.48%
1 ene 1971 año
40.359
+6.652
19.73%
1 ene 1972 año
57.253
+16.894
41.86%
1 ene 1974 año
50.003
-7.25
-12.66%
1 ene 1975 año
45.785
-4.218
-8.44%
1 ene 1976 año
53.995
+8.21
17.93%
1 ene 1977 año
50.498
-3.498
-6.48%
1 ene 1978 año
45.344
-5.154
-10.21%
1 ene 1979 año
34.543
-10.801
-23.82%
1 ene 1980 año
24.562
-9.981
-28.9%
1 ene 1981 año
32.162
+7.601
30.94%
1 ene 1982 año
26.619
-5.543
-17.23%
1 ene 1983 año
83.229
+56.609
212.66%
1 ene 1984 año
85.846
+2.617
3.14%
1 ene 1985 año
78.576
-7.27
-8.47%
1 ene 1986 año
75.393
-3.183
-4.05%
1 ene 1987 año
65.382
-10.011
-13.28%
1 ene 1988 año
69.521
+4.139
6.33%
1 ene 1989 año
73.214
+3.693
5.31%
1 ene 1990 año
78.187
+4.973
6.79%
1 ene 1991 año
75.047
-3.14
-4.02%
1 ene 1992 año
79.983
+4.936
6.58%
1 ene 1993 año
72.915
-7.068
-8.84%
1 ene 1994 año
74.002
+1.087
1.49%
1 ene 1995 año
64.749
-9.253
-12.5%
1 ene 1996 año
64.143
-0.606
-0.94%
1 ene 1997 año
74.584
+10.44
16.28%
1 ene 1998 año
60.696
-13.888
-18.62%
1 ene 1999 año
48.261
-12.435
-20.49%
1 ene 2000 año
43.017
-5.244
-10.87%
1 ene 2001 año
39.218
-3.799
-8.83%
1 ene 2002 año
41.528
+2.31
5.89%
1 ene 2003 año
49.915
+8.387
20.2%
1 ene 2004 año
40.647
-9.268
-18.57%
1 ene 2005 año
40.887
+0.24
0.59%
1 ene 2006 año
33.693
-7.195
-17.6%
1 ene 2007 año
34.893
+1.2
3.56%
1 ene 2008 año
31.778
-3.115
-8.93%
1 ene 2009 año
31.348
-0.43
-1.35%
1 ene 2010 año
46.698
+15.349
48.96%
1 ene 2011 año
49.616
+2.918
6.25%
1 ene 2012 año
52.912
+3.297
6.64%
1 ene 2013 año
44.533
-8.379
-15.84%
1 ene 2014 año
39.129
-5.404
-12.14%
1 ene 2015 año
34.173
-4.956
-12.67%
Ranking de los países por los datos estadísticos actuales


Comentarios: