29
/es/
es
AIzaSyAYiBZKx7MnpbEhh9jyipgxe19OcubqV5w
April 1, 2024
113870
Cote d'Ivoire
CIV
true
2
1
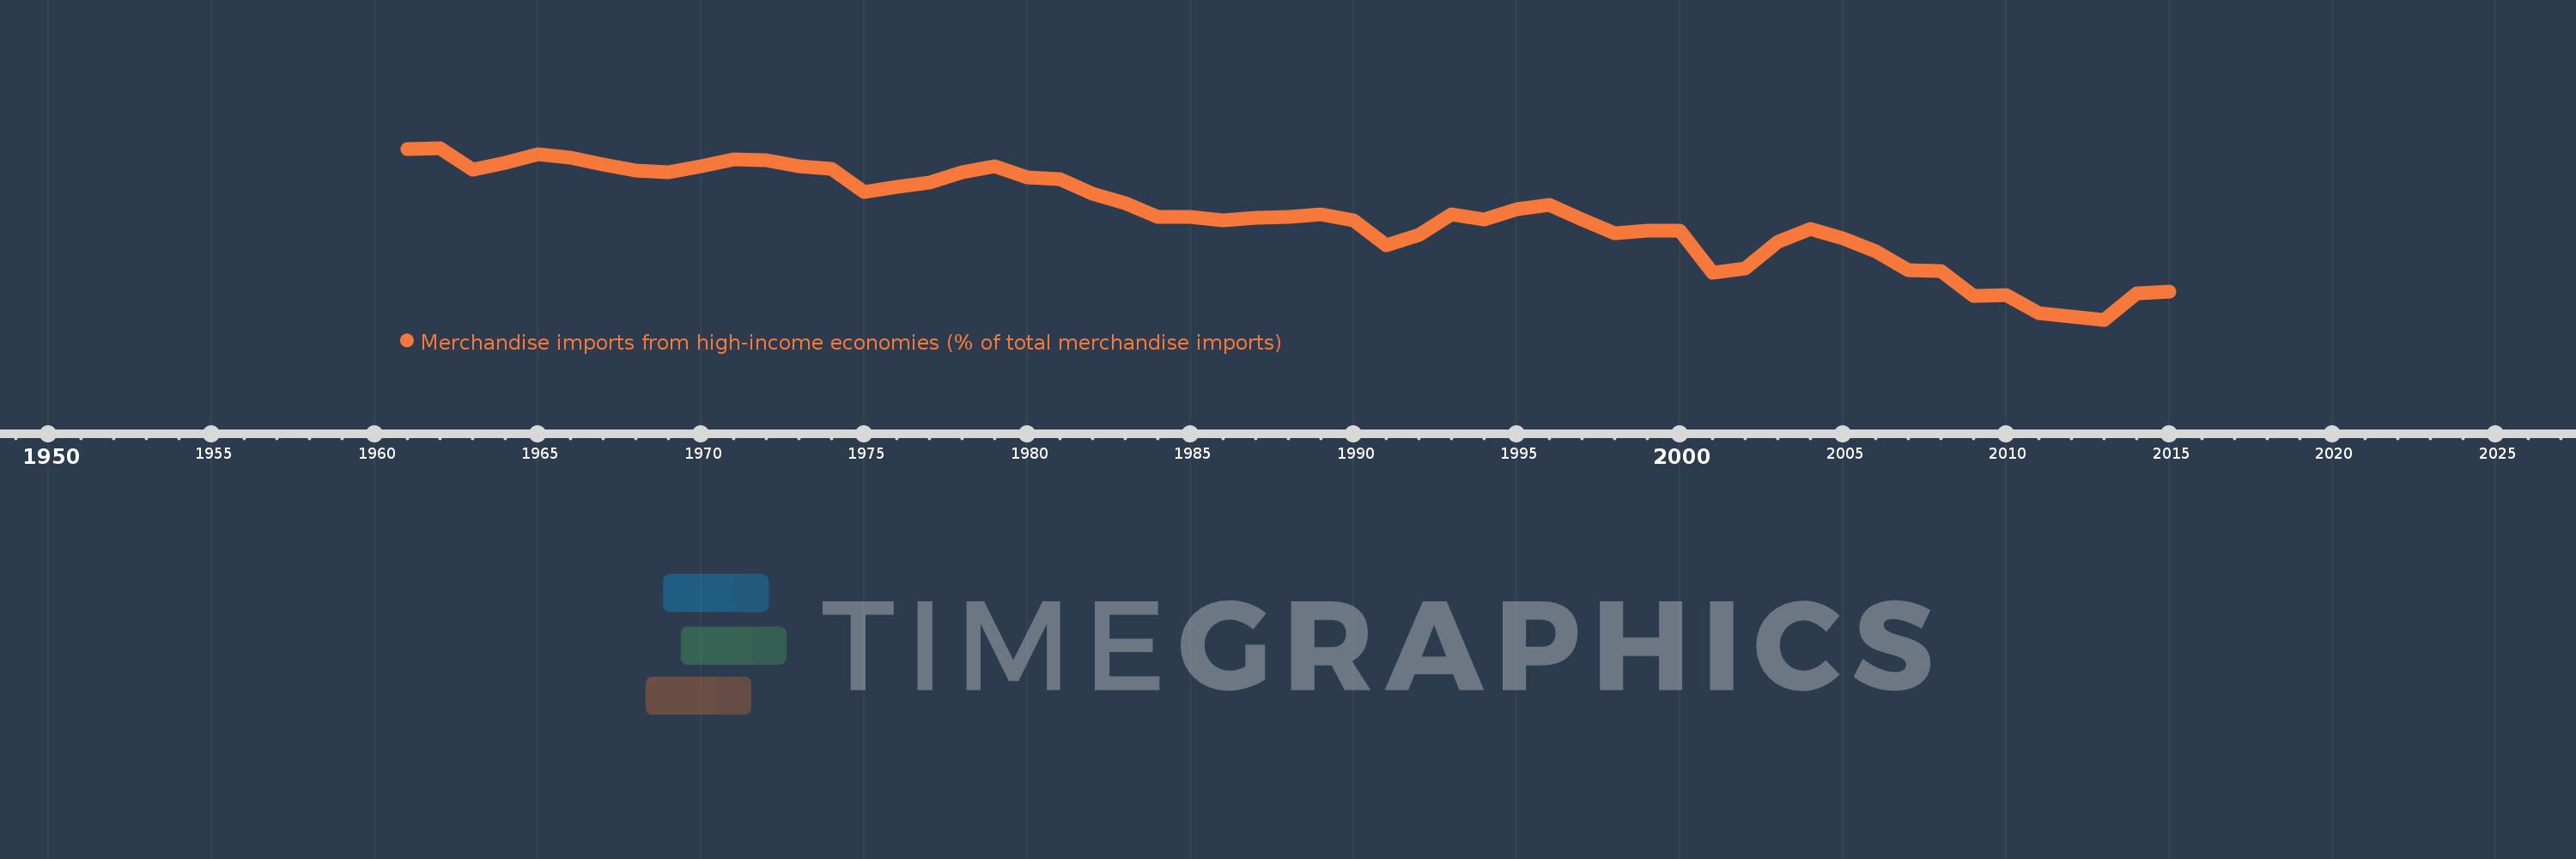
Merchandise imports from high-income economies (% of total merchandise imports)
2015,2014,2013,2012,2011,2010,2009,2008,2007,2006,2005,2004,2003,2002,2001,2000,1999,1998,1997,1996,1995,1994,1993,1992,1991,1990,1989,1988,1987,1986,1985,1984,1983,1982,1981,1980,1979,1978,1977,1976,1975,1974,1973,1972,1971,1970,1969,1968,1967,1966,1965,1964,1963,1962,1961
Estas estadísticas en otros países:
AfghanistanAlbaniaAlgeriaAngolaAntigua and BarbudaArab WorldArgentinaArmeniaArubaAustraliaAustriaAzerbaijanBahamas, TheBahrainBangladeshBarbadosBelarusBelgiumBelizeBeninBermudaBoliviaBosnia and HerzegovinaBrazilBrunei DarussalamBulgariaBurkina FasoBurundiCabo VerdeCambodiaCameroonCanadaCaribbean small statesCentral African RepublicCentral Europe and the BalticsChadChileChinaColombiaComorosCongo, Dem. Rep.Congo, Rep.Costa RicaCote d'IvoireCroatiaCubaCyprusCzech RepublicDenmarkDjiboutiDominicaDominican RepublicEarly-demographic dividendEast Asia & PacificEast Asia & Pacific (excluding high income)East Asia & Pacific (IDA & IBRD countries)EcuadorEgypt, Arab Rep.El SalvadorEquatorial GuineaEstoniaEthiopiaEuro areaEurope & Central AsiaEurope & Central Asia (excluding high income)Europe & Central Asia (IDA & IBRD countries)European UnionFaroe IslandsFijiFinlandFragile and conflict affected situationsFranceFrench PolynesiaGabonGambia, TheGeorgiaGermanyGhanaGibraltarGreeceGreenlandGrenadaGuamGuatemalaGuineaGuinea-BissauGuyanaHaitiHeavily indebted poor countries (HIPC)High incomeHondurasHong Kong SAR, ChinaHungaryIBRD onlyIcelandIDA & IBRD totalIDA blendIDA onlyIDA totalIndiaIndonesiaIran, Islamic Rep.IraqIrelandIsraelItalyJamaicaJapanJordanKazakhstanKenyaKiribatiKorea, Dem. People’s Rep.Korea, Rep.KosovoKuwaitKyrgyz RepublicLao PDRLate-demographic dividendLatin America & Caribbean Latin America & Caribbean (excluding high income)Latin America & the Caribbean (IDA & IBRD countries)LatviaLeast developed countries: UN classificationLebanonLiberiaLibyaLithuaniaLow & middle incomeLow incomeLower middle incomeLuxembourgMacao SAR, ChinaMacedonia, FYRMadagascarMalawiMalaysiaMaldivesMaliMaltaMauritaniaMauritiusMexicoMiddle East & North AfricaMiddle East & North Africa (excluding high income)Middle East & North Africa (IDA & IBRD countries)Middle incomeMoldovaMongoliaMontenegroMoroccoMozambiqueMyanmarNauruNepalNetherlandsNew CaledoniaNew ZealandNicaraguaNigerNigeriaNorth AmericaNorwayOECD membersOmanOther small statesPacific island small statesPakistanPanamaPapua New GuineaParaguayPeruPhilippinesPolandPortugalPost-demographic dividendPre-demographic dividendQatarRomaniaRussian FederationRwandaSamoaSao Tome and PrincipeSaudi ArabiaSenegalSerbiaSeychellesSierra LeoneSingaporeSlovak RepublicSloveniaSmall statesSolomon IslandsSomaliaSouth AfricaSouth AsiaSouth Asia (IDA & IBRD)SpainSri LankaSt. Kitts and NevisSt. LuciaSt. Vincent and the GrenadinesSub-Saharan Africa Sub-Saharan Africa (excluding high income)Sub-Saharan Africa (IDA & IBRD countries)SudanSurinameSwedenSwitzerlandSyrian Arab RepublicTajikistanTanzaniaThailandTogoTongaTrinidad and TobagoTunisiaTurkeyTurkmenistanTuvaluUgandaUkraineUnited Arab EmiratesUnited KingdomUnited StatesUpper middle incomeUruguayUzbekistanVanuatuVenezuela, RBVietnamWorldYemen, Rep.ZambiaZimbabwe línea de tiempo (timeline):
En esta escala de tiempo se presenta un gráfico de 1961 y 2015 de Cote d'Ivoire. Los datos de 1960 están ausentes. El número de observaciones reales por fecha: 55.
Fuente (nombre):
Indicadores del desarrollo mundial
Fuente (organización):
World Bank staff estimates based data from International Monetary Fund's Direction of Trade database.
Categorías:
Private Sector, Trade
Se ha actualizado:
23 abr 2017 año
Los indicadores de los cambios de valor en los últimos años
Mínimo:
34.781
1 ene 2013 año
Máximo:
88.61
1 ene 1962 año
A la fecha de observación
Valor
Cambio absoluto
El cambio con respecto al valor anterior
1 ene 1961 año
88.309
+88.309
0.0%
1 ene 1962 año
88.61
+0.301
0.34%
1 ene 1963 año
81.818
-6.792
-7.66%
1 ene 1964 año
83.873
+2.055
2.51%
1 ene 1965 año
86.667
+2.794
3.33%
1 ene 1966 año
85.502
-1.164
-1.34%
1 ene 1967 año
83.502
-2.001
-2.34%
1 ene 1968 año
81.596
-1.906
-2.28%
1 ene 1969 año
80.925
-0.671
-0.82%
1 ene 1970 año
82.988
+2.063
2.55%
1 ene 1971 año
84.987
+1.999
2.41%
1 ene 1972 año
84.744
-0.243
-0.29%
1 ene 1973 año
82.769
-1.974
-2.33%
1 ene 1974 año
82.19
-0.579
-0.7%
1 ene 1975 año
74.709
-7.482
-9.1%
1 ene 1976 año
76.383
+1.674
2.24%
1 ene 1977 año
77.63
+1.247
1.63%
1 ene 1978 año
80.965
+3.335
4.3%
1 ene 1979 año
82.797
+1.832
2.26%
1 ene 1980 año
79.392
-3.405
-4.11%
1 ene 1981 año
78.776
-0.616
-0.78%
1 ene 1982 año
74.355
-4.421
-5.61%
1 ene 1983 año
71.206
-3.148
-4.23%
1 ene 1984 año
67.091
-4.115
-5.78%
1 ene 1985 año
66.906
-0.186
-0.28%
1 ene 1986 año
66.053
-0.853
-1.28%
1 ene 1987 año
66.64
+0.588
0.89%
1 ene 1988 año
67.126
+0.486
0.73%
1 ene 1989 año
67.906
+0.78
1.16%
1 ene 1990 año
65.826
-2.08
-3.06%
1 ene 1991 año
58.21
-7.616
-11.57%
1 ene 1992 año
61.316
+3.105
5.33%
1 ene 1993 año
67.828
+6.513
10.62%
1 ene 1994 año
66.235
-1.594
-2.35%
1 ene 1995 año
69.333
+3.098
4.68%
1 ene 1996 año
70.726
+1.393
2.01%
1 ene 1997 año
66.254
-4.472
-6.32%
1 ene 1998 año
61.947
-4.307
-6.5%
1 ene 1999 año
62.76
+0.813
1.31%
1 ene 2000 año
62.591
-0.169
-0.27%
1 ene 2001 año
49.444
-13.147
-21.0%
1 ene 2002 año
50.803
+1.359
2.75%
1 ene 2003 año
59.237
+8.434
16.6%
1 ene 2004 año
63.139
+3.902
6.59%
1 ene 2005 año
60.295
-2.844
-4.5%
1 ene 2006 año
56.195
-4.1
-6.8%
1 ene 2007 año
50.325
-5.87
-10.45%
1 ene 2008 año
50.136
-0.189
-0.38%
1 ene 2009 año
42.14
-7.996
-15.95%
1 ene 2010 año
42.484
+0.344
0.82%
1 ene 2011 año
36.877
-5.607
-13.2%
1 ene 2012 año
35.851
-1.026
-2.78%
1 ene 2013 año
34.781
-1.069
-2.98%
1 ene 2014 año
43.133
+8.351
24.01%
1 ene 2015 año
43.638
+0.505
1.17%
Ranking de los países por los datos estadísticos actuales


Comentarios: