29
/es/
es
AIzaSyAYiBZKx7MnpbEhh9jyipgxe19OcubqV5w
April 1, 2024
34391
Fragile and conflict affected situations
FCS
false
2
1
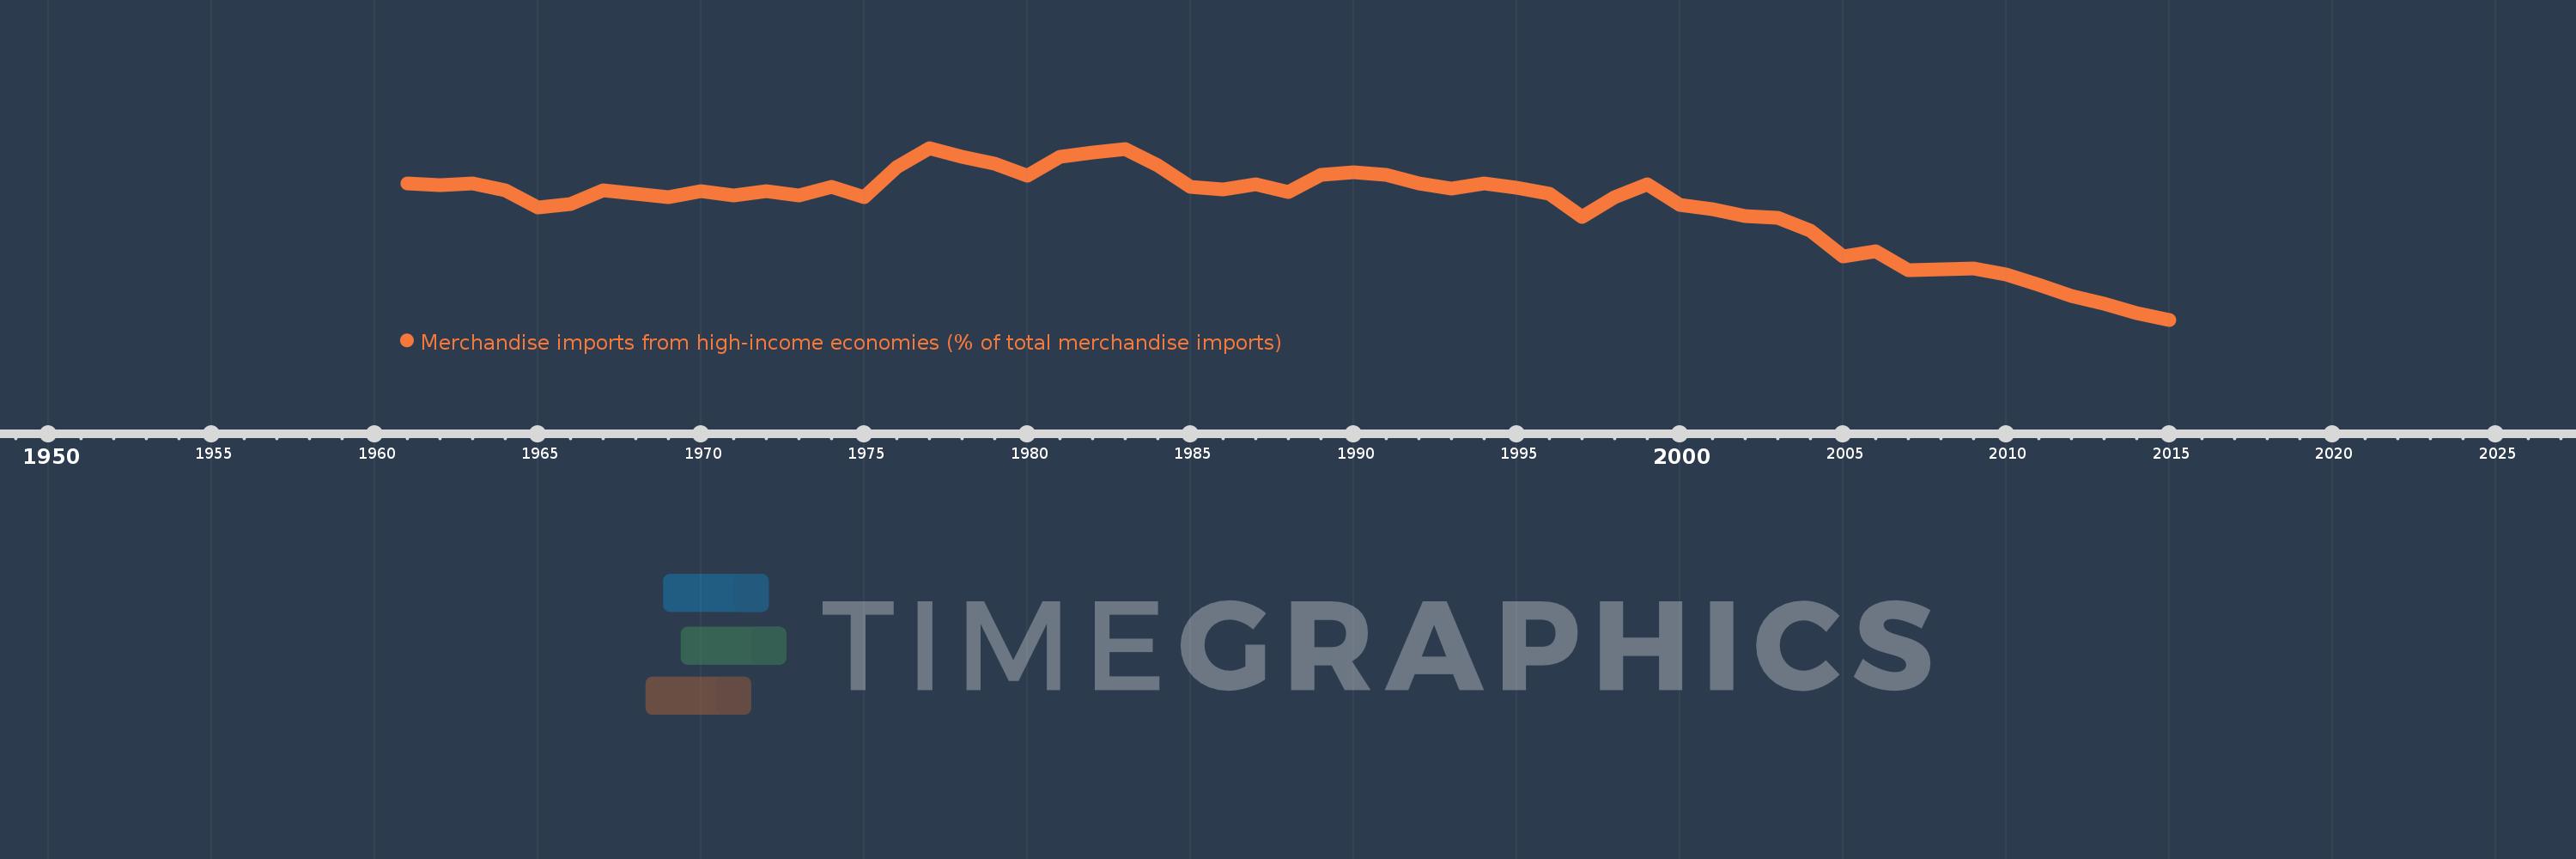
Merchandise imports from high-income economies (% of total merchandise imports)
2015,2014,2013,2012,2011,2010,2009,2008,2007,2006,2005,2004,2003,2002,2001,2000,1999,1998,1997,1996,1995,1994,1993,1992,1991,1990,1989,1988,1987,1986,1985,1984,1983,1982,1981,1980,1979,1978,1977,1976,1975,1974,1973,1972,1971,1970,1969,1968,1967,1966,1965,1964,1963,1962,1961
Estas estadísticas en otros países:
AfghanistanAlbaniaAlgeriaAngolaAntigua and BarbudaArab WorldArgentinaArmeniaArubaAustraliaAustriaAzerbaijanBahamas, TheBahrainBangladeshBarbadosBelarusBelgiumBelizeBeninBermudaBoliviaBosnia and HerzegovinaBrazilBrunei DarussalamBulgariaBurkina FasoBurundiCabo VerdeCambodiaCameroonCanadaCaribbean small statesCentral African RepublicCentral Europe and the BalticsChadChileChinaColombiaComorosCongo, Dem. Rep.Congo, Rep.Costa RicaCote d'IvoireCroatiaCubaCyprusCzech RepublicDenmarkDjiboutiDominicaDominican RepublicEarly-demographic dividendEast Asia & PacificEast Asia & Pacific (excluding high income)East Asia & Pacific (IDA & IBRD countries)EcuadorEgypt, Arab Rep.El SalvadorEquatorial GuineaEstoniaEthiopiaEuro areaEurope & Central AsiaEurope & Central Asia (excluding high income)Europe & Central Asia (IDA & IBRD countries)European UnionFaroe IslandsFijiFinlandFragile and conflict affected situationsFranceFrench PolynesiaGabonGambia, TheGeorgiaGermanyGhanaGibraltarGreeceGreenlandGrenadaGuamGuatemalaGuineaGuinea-BissauGuyanaHaitiHeavily indebted poor countries (HIPC)High incomeHondurasHong Kong SAR, ChinaHungaryIBRD onlyIcelandIDA & IBRD totalIDA blendIDA onlyIDA totalIndiaIndonesiaIran, Islamic Rep.IraqIrelandIsraelItalyJamaicaJapanJordanKazakhstanKenyaKiribatiKorea, Dem. People’s Rep.Korea, Rep.KosovoKuwaitKyrgyz RepublicLao PDRLate-demographic dividendLatin America & Caribbean Latin America & Caribbean (excluding high income)Latin America & the Caribbean (IDA & IBRD countries)LatviaLeast developed countries: UN classificationLebanonLiberiaLibyaLithuaniaLow & middle incomeLow incomeLower middle incomeLuxembourgMacao SAR, ChinaMacedonia, FYRMadagascarMalawiMalaysiaMaldivesMaliMaltaMauritaniaMauritiusMexicoMiddle East & North AfricaMiddle East & North Africa (excluding high income)Middle East & North Africa (IDA & IBRD countries)Middle incomeMoldovaMongoliaMontenegroMoroccoMozambiqueMyanmarNauruNepalNetherlandsNew CaledoniaNew ZealandNicaraguaNigerNigeriaNorth AmericaNorwayOECD membersOmanOther small statesPacific island small statesPakistanPanamaPapua New GuineaParaguayPeruPhilippinesPolandPortugalPost-demographic dividendPre-demographic dividendQatarRomaniaRussian FederationRwandaSamoaSao Tome and PrincipeSaudi ArabiaSenegalSerbiaSeychellesSierra LeoneSingaporeSlovak RepublicSloveniaSmall statesSolomon IslandsSomaliaSouth AfricaSouth AsiaSouth Asia (IDA & IBRD)SpainSri LankaSt. Kitts and NevisSt. LuciaSt. Vincent and the GrenadinesSub-Saharan Africa Sub-Saharan Africa (excluding high income)Sub-Saharan Africa (IDA & IBRD countries)SudanSurinameSwedenSwitzerlandSyrian Arab RepublicTajikistanTanzaniaThailandTogoTongaTrinidad and TobagoTunisiaTurkeyTurkmenistanTuvaluUgandaUkraineUnited Arab EmiratesUnited KingdomUnited StatesUpper middle incomeUruguayUzbekistanVanuatuVenezuela, RBVietnamWorldYemen, Rep.ZambiaZimbabwe línea de tiempo (timeline):
En esta escala de tiempo se presenta un gráfico de 1961 y 2015 de Fragile and conflict affected situations. Los datos de 1960 están ausentes. El número de observaciones reales por fecha: 55.
Fuente (nombre):
Indicadores del desarrollo mundial
Fuente (organización):
World Bank staff estimates based data from International Monetary Fund's Direction of Trade database.
Categorías:
Private Sector, Trade
Se ha actualizado:
23 abr 2017 año
Los indicadores de los cambios de valor en los últimos años
Mínimo:
42.513
1 ene 2015 año
Máximo:
77.565
1 ene 1977 año
A la fecha de observación
Valor
Cambio absoluto
El cambio con respecto al valor anterior
1 ene 1961 año
70.25
+70.25
0.0%
1 ene 1962 año
70.051
-0.199
-0.28%
1 ene 1963 año
70.313
+0.262
0.37%
1 ene 1964 año
68.941
-1.372
-1.95%
1 ene 1965 año
65.383
-3.558
-5.16%
1 ene 1966 año
66.163
+0.78
1.19%
1 ene 1967 año
69.005
+2.842
4.29%
1 ene 1968 año
68.224
-0.78
-1.13%
1 ene 1969 año
67.514
-0.711
-1.04%
1 ene 1970 año
68.712
+1.198
1.77%
1 ene 1971 año
67.875
-0.837
-1.22%
1 ene 1972 año
68.674
+0.799
1.18%
1 ene 1973 año
67.917
-0.757
-1.1%
1 ene 1974 año
69.71
+1.793
2.64%
1 ene 1975 año
67.443
-2.267
-3.25%
1 ene 1976 año
73.628
+6.185
9.17%
1 ene 1977 año
77.565
+3.937
5.35%
1 ene 1978 año
75.841
-1.724
-2.22%
1 ene 1979 año
74.441
-1.4
-1.85%
1 ene 1980 año
71.973
-2.469
-3.32%
1 ene 1981 año
75.788
+3.815
5.3%
1 ene 1982 año
76.637
+0.849
1.12%
1 ene 1983 año
77.271
+0.634
0.83%
1 ene 1984 año
74.078
-3.193
-4.13%
1 ene 1985 año
69.667
-4.411
-5.95%
1 ene 1986 año
69.125
-0.542
-0.78%
1 ene 1987 año
70.227
+1.101
1.59%
1 ene 1988 año
68.564
-1.663
-2.37%
1 ene 1989 año
72.084
+3.52
5.13%
1 ene 1990 año
72.677
+0.592
0.82%
1 ene 1991 año
72.12
-0.557
-0.77%
1 ene 1992 año
70.28
-1.84
-2.55%
1 ene 1993 año
69.269
-1.011
-1.44%
1 ene 1994 año
70.343
+1.075
1.55%
1 ene 1995 año
69.39
-0.954
-1.36%
1 ene 1996 año
68.223
-1.167
-1.68%
1 ene 1997 año
63.518
-4.705
-6.9%
1 ene 1998 año
67.502
+3.984
6.27%
1 ene 1999 año
70.181
+2.679
3.97%
1 ene 2000 año
65.936
-4.244
-6.05%
1 ene 2001 año
65.01
-0.926
-1.4%
1 ene 2002 año
63.692
-1.318
-2.03%
1 ene 2003 año
63.349
-0.343
-0.54%
1 ene 2004 año
60.625
-2.724
-4.3%
1 ene 2005 año
55.377
-5.248
-8.66%
1 ene 2006 año
56.401
+1.024
1.85%
1 ene 2007 año
52.691
-3.71
-6.58%
1 ene 2008 año
52.786
+0.095
0.18%
1 ene 2009 año
53.019
+0.233
0.44%
1 ene 2010 año
51.746
-1.274
-2.4%
1 ene 2011 año
49.714
-2.031
-3.93%
1 ene 2012 año
47.449
-2.265
-4.56%
1 ene 2013 año
45.8
-1.649
-3.47%
1 ene 2014 año
43.919
-1.882
-4.11%
1 ene 2015 año
42.513
-1.406
-3.2%
Ranking de los países por los datos estadísticos actuales


Comentarios: