29
/es/
es
AIzaSyAYiBZKx7MnpbEhh9jyipgxe19OcubqV5w
April 1, 2024
47355
Lower middle income
LMC
false
2
1
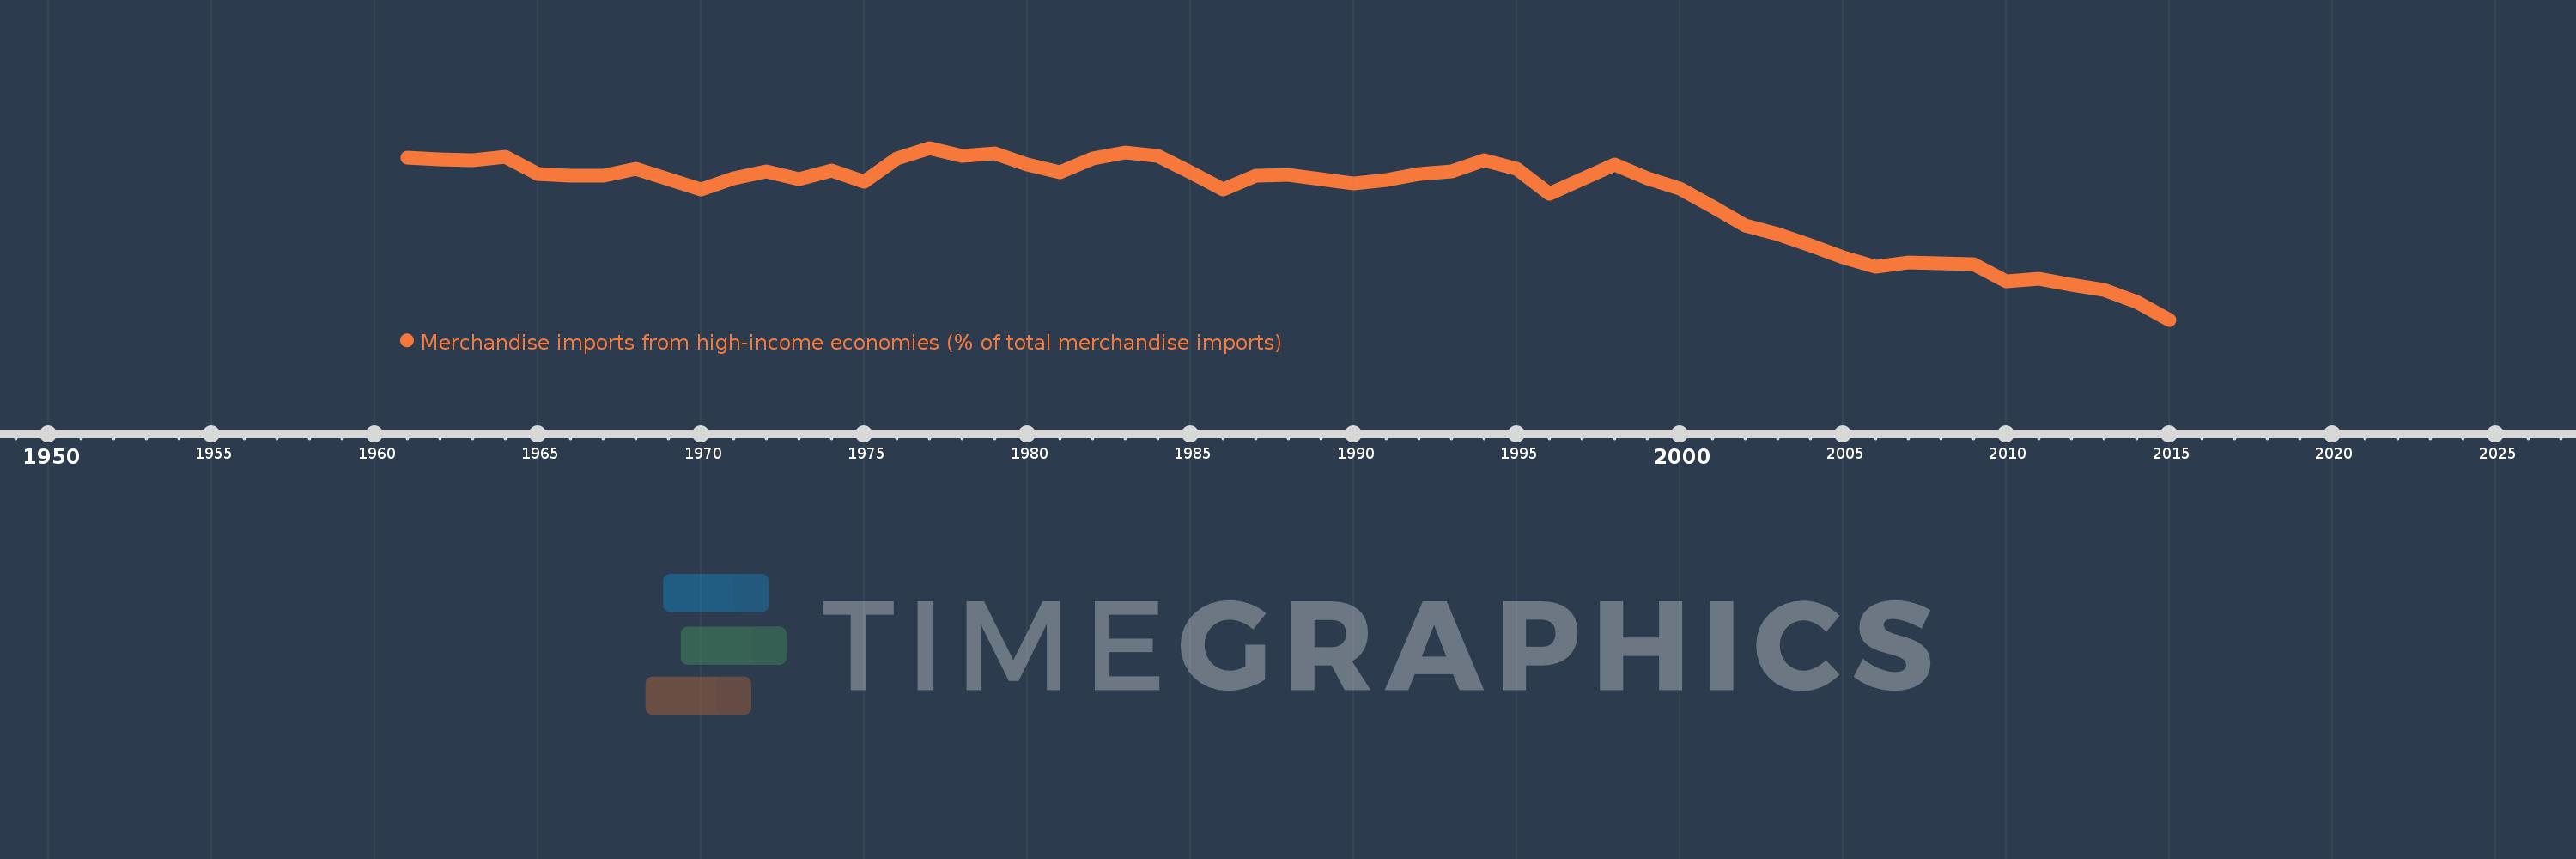
Merchandise imports from high-income economies (% of total merchandise imports)
2015,2014,2013,2012,2011,2010,2009,2008,2007,2006,2005,2004,2003,2002,2001,2000,1999,1998,1997,1996,1995,1994,1993,1992,1991,1990,1989,1988,1987,1986,1985,1984,1983,1982,1981,1980,1979,1978,1977,1976,1975,1974,1973,1972,1971,1970,1969,1968,1967,1966,1965,1964,1963,1962,1961
Estas estadísticas en otros países:
AfghanistanAlbaniaAlgeriaAngolaAntigua and BarbudaArab WorldArgentinaArmeniaArubaAustraliaAustriaAzerbaijanBahamas, TheBahrainBangladeshBarbadosBelarusBelgiumBelizeBeninBermudaBoliviaBosnia and HerzegovinaBrazilBrunei DarussalamBulgariaBurkina FasoBurundiCabo VerdeCambodiaCameroonCanadaCaribbean small statesCentral African RepublicCentral Europe and the BalticsChadChileChinaColombiaComorosCongo, Dem. Rep.Congo, Rep.Costa RicaCote d'IvoireCroatiaCubaCyprusCzech RepublicDenmarkDjiboutiDominicaDominican RepublicEarly-demographic dividendEast Asia & PacificEast Asia & Pacific (excluding high income)East Asia & Pacific (IDA & IBRD countries)EcuadorEgypt, Arab Rep.El SalvadorEquatorial GuineaEstoniaEthiopiaEuro areaEurope & Central AsiaEurope & Central Asia (excluding high income)Europe & Central Asia (IDA & IBRD countries)European UnionFaroe IslandsFijiFinlandFragile and conflict affected situationsFranceFrench PolynesiaGabonGambia, TheGeorgiaGermanyGhanaGibraltarGreeceGreenlandGrenadaGuamGuatemalaGuineaGuinea-BissauGuyanaHaitiHeavily indebted poor countries (HIPC)High incomeHondurasHong Kong SAR, ChinaHungaryIBRD onlyIcelandIDA & IBRD totalIDA blendIDA onlyIDA totalIndiaIndonesiaIran, Islamic Rep.IraqIrelandIsraelItalyJamaicaJapanJordanKazakhstanKenyaKiribatiKorea, Dem. People’s Rep.Korea, Rep.KosovoKuwaitKyrgyz RepublicLao PDRLate-demographic dividendLatin America & Caribbean Latin America & Caribbean (excluding high income)Latin America & the Caribbean (IDA & IBRD countries)LatviaLeast developed countries: UN classificationLebanonLiberiaLibyaLithuaniaLow & middle incomeLow incomeLower middle incomeLuxembourgMacao SAR, ChinaMacedonia, FYRMadagascarMalawiMalaysiaMaldivesMaliMaltaMauritaniaMauritiusMexicoMiddle East & North AfricaMiddle East & North Africa (excluding high income)Middle East & North Africa (IDA & IBRD countries)Middle incomeMoldovaMongoliaMontenegroMoroccoMozambiqueMyanmarNauruNepalNetherlandsNew CaledoniaNew ZealandNicaraguaNigerNigeriaNorth AmericaNorwayOECD membersOmanOther small statesPacific island small statesPakistanPanamaPapua New GuineaParaguayPeruPhilippinesPolandPortugalPost-demographic dividendPre-demographic dividendQatarRomaniaRussian FederationRwandaSamoaSao Tome and PrincipeSaudi ArabiaSenegalSerbiaSeychellesSierra LeoneSingaporeSlovak RepublicSloveniaSmall statesSolomon IslandsSomaliaSouth AfricaSouth AsiaSouth Asia (IDA & IBRD)SpainSri LankaSt. Kitts and NevisSt. LuciaSt. Vincent and the GrenadinesSub-Saharan Africa Sub-Saharan Africa (excluding high income)Sub-Saharan Africa (IDA & IBRD countries)SudanSurinameSwedenSwitzerlandSyrian Arab RepublicTajikistanTanzaniaThailandTogoTongaTrinidad and TobagoTunisiaTurkeyTurkmenistanTuvaluUgandaUkraineUnited Arab EmiratesUnited KingdomUnited StatesUpper middle incomeUruguayUzbekistanVanuatuVenezuela, RBVietnamWorldYemen, Rep.ZambiaZimbabwe línea de tiempo (timeline):
En esta escala de tiempo se presenta un gráfico de 1961 y 2015 de Lower middle income. Los datos de 1960 están ausentes. El número de observaciones reales por fecha: 55.
Fuente (nombre):
Indicadores del desarrollo mundial
Fuente (organización):
World Bank staff estimates based data from International Monetary Fund's Direction of Trade database.
Categorías:
Private Sector, Trade
Se ha actualizado:
23 abr 2017 año
Los indicadores de los cambios de valor en los últimos años
Mínimo:
55.209
1 ene 2015 año
Máximo:
78.97
1 ene 1977 año
A la fecha de observación
Valor
Cambio absoluto
El cambio con respecto al valor anterior
1 ene 1961 año
77.668
+77.668
0.0%
1 ene 1962 año
77.35
-0.319
-0.41%
1 ene 1963 año
77.263
-0.087
-0.11%
1 ene 1964 año
77.742
+0.48
0.62%
1 ene 1965 año
75.312
-2.43
-3.13%
1 ene 1966 año
75.182
-0.13
-0.17%
1 ene 1967 año
75.158
-0.025
-0.03%
1 ene 1968 año
76.097
+0.939
1.25%
1 ene 1969 año
74.686
-1.411
-1.85%
1 ene 1970 año
73.174
-1.512
-2.02%
1 ene 1971 año
74.726
+1.552
2.12%
1 ene 1972 año
75.766
+1.04
1.39%
1 ene 1973 año
74.654
-1.111
-1.47%
1 ene 1974 año
75.825
+1.171
1.57%
1 ene 1975 año
74.283
-1.542
-2.03%
1 ene 1976 año
77.563
+3.28
4.42%
1 ene 1977 año
78.97
+1.407
1.81%
1 ene 1978 año
77.851
-1.119
-1.42%
1 ene 1979 año
78.19
+0.34
0.44%
1 ene 1980 año
76.625
-1.566
-2.0%
1 ene 1981 año
75.591
-1.033
-1.35%
1 ene 1982 año
77.45
+1.858
2.46%
1 ene 1983 año
78.293
+0.844
1.09%
1 ene 1984 año
77.879
-0.415
-0.53%
1 ene 1985 año
75.667
-2.211
-2.84%
1 ene 1986 año
73.198
-2.47
-3.26%
1 ene 1987 año
75.115
+1.917
2.62%
1 ene 1988 año
75.259
+0.144
0.19%
1 ene 1989 año
74.642
-0.617
-0.82%
1 ene 1990 año
74.034
-0.607
-0.81%
1 ene 1991 año
74.574
+0.54
0.73%
1 ene 1992 año
75.415
+0.841
1.13%
1 ene 1993 año
75.762
+0.348
0.46%
1 ene 1994 año
77.288
+1.526
2.01%
1 ene 1995 año
76.035
-1.253
-1.62%
1 ene 1996 año
72.678
-3.357
-4.42%
1 ene 1997 año
74.65
+1.972
2.71%
1 ene 1998 año
76.698
+2.048
2.74%
1 ene 1999 año
74.82
-1.879
-2.45%
1 ene 2000 año
73.408
-1.412
-1.89%
1 ene 2001 año
70.801
-2.607
-3.55%
1 ene 2002 año
68.3
-2.501
-3.53%
1 ene 2003 año
67.023
-1.277
-1.87%
1 ene 2004 año
65.536
-1.486
-2.22%
1 ene 2005 año
63.841
-1.695
-2.59%
1 ene 2006 año
62.511
-1.33
-2.08%
1 ene 2007 año
63.17
+0.66
1.06%
1 ene 2008 año
62.989
-0.182
-0.29%
1 ene 2009 año
62.915
-0.073
-0.12%
1 ene 2010 año
60.545
-2.371
-3.77%
1 ene 2011 año
60.879
+0.334
0.55%
1 ene 2012 año
60.018
-0.861
-1.41%
1 ene 2013 año
59.357
-0.662
-1.1%
1 ene 2014 año
57.63
-1.726
-2.91%
1 ene 2015 año
55.209
-2.422
-4.2%
Ranking de los países por los datos estadísticos actuales


Comentarios: