29
/es/
es
AIzaSyAYiBZKx7MnpbEhh9jyipgxe19OcubqV5w
April 1, 2024
63621
Afghanistan
AFG
true
2
1
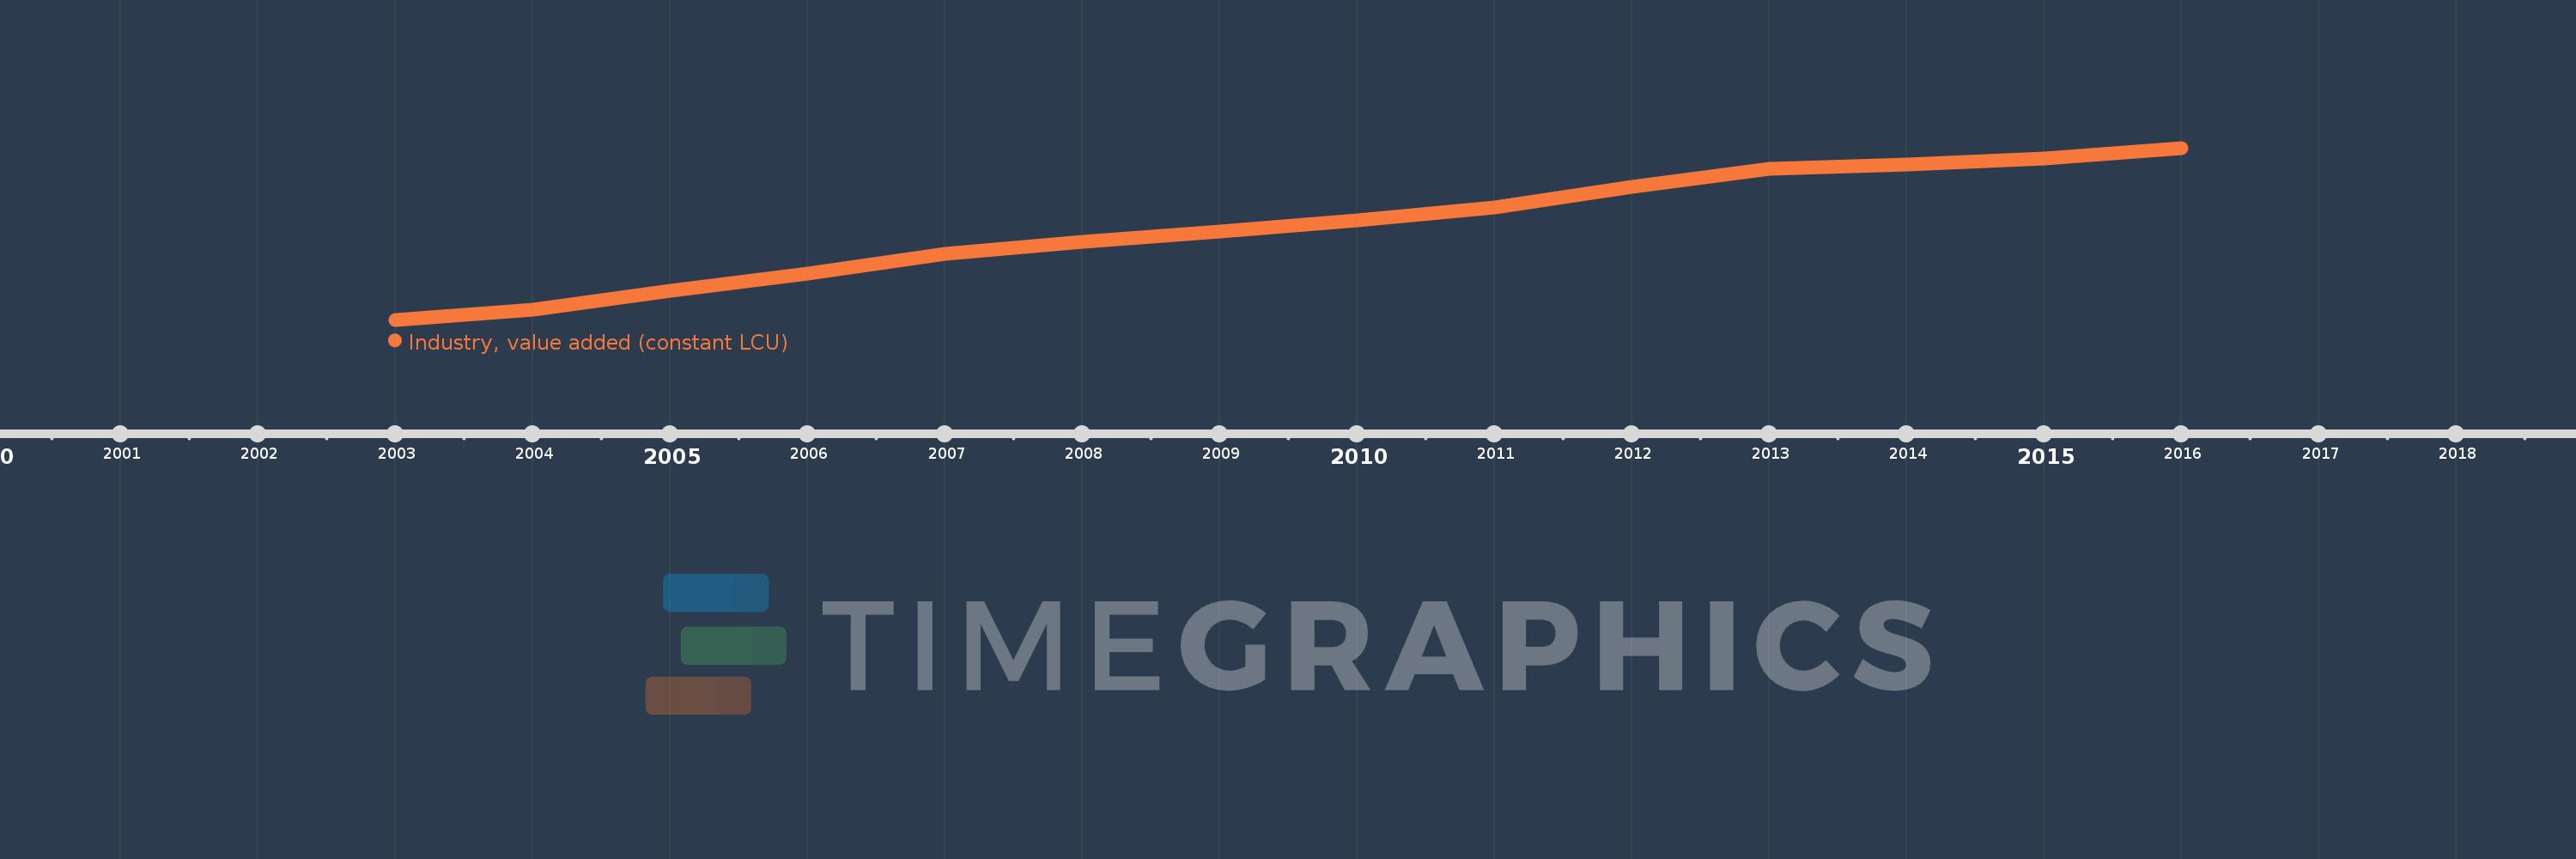
Industry, value added (constant LCU)
2016,2015,2014,2013,2012,2011,2010,2009,2008,2007,2006,2005,2004,2003
Estas estadísticas en otros países:
AfghanistanAlbaniaAlgeriaAntigua and BarbudaArgentinaArmeniaAustraliaAustriaAzerbaijanBahamas, TheBahrainBangladeshBelarusBelgiumBelizeBeninBermudaBhutanBoliviaBosnia and HerzegovinaBotswanaBrazilBrunei DarussalamBulgariaBurkina FasoBurundiCabo VerdeCambodiaCameroonCanadaCayman IslandsCentral African RepublicChadChileChinaColombiaComorosCongo, Dem. Rep.Congo, Rep.Costa RicaCote d'IvoireCroatiaCubaCyprusCzech RepublicDenmarkDjiboutiDominicaDominican RepublicEcuadorEgypt, Arab Rep.El SalvadorEquatorial GuineaEritreaEstoniaEthiopiaFijiFinlandFranceGabonGambia, TheGeorgiaGermanyGhanaGreeceGrenadaGuatemalaGuineaGuinea-BissauGuyanaHaitiHondurasHong Kong SAR, ChinaHungaryIcelandIndiaIndonesiaIran, Islamic Rep.IraqIrelandItalyJamaicaJapanJordanKazakhstanKenyaKiribatiKorea, Rep.KosovoKuwaitKyrgyz RepublicLao PDRLatviaLebanonLesothoLiberiaLithuaniaLuxembourgMacedonia, FYRMadagascarMalawiMalaysiaMaldivesMaliMarshall IslandsMauritaniaMauritiusMexicoMicronesia, Fed. Sts.MoldovaMongoliaMontenegroMoroccoMozambiqueMyanmarNamibiaNepalNetherlandsNew ZealandNicaraguaNigerNigeriaNorwayOmanPakistanPalauPanamaPapua New GuineaParaguayPeruPhilippinesPolandPortugalPuerto RicoQatarRomaniaRussian FederationRwandaSamoaSao Tome and PrincipeSaudi ArabiaSenegalSerbiaSeychellesSierra LeoneSingaporeSlovak RepublicSloveniaSolomon IslandsSomaliaSouth AfricaSpainSri LankaSt. Kitts and NevisSt. LuciaSt. Vincent and the GrenadinesSudanSurinameSwazilandSwedenSwitzerlandSyrian Arab RepublicTajikistanTanzaniaThailandTimor-LesteTogoTongaTrinidad and TobagoTunisiaTurkeyTurkmenistanTuvaluUgandaUkraineUnited Arab EmiratesUnited KingdomUnited StatesUruguayUzbekistanVanuatuVenezuela, RBVietnamWest Bank and GazaZambiaZimbabwe línea de tiempo (timeline):
En esta escala de tiempo se presenta un gráfico de 2003 y 2016 de Afghanistan. Los datos de 2002 están ausentes. El número de observaciones reales por fecha: 14.
Fuente (nombre):
Indicadores del desarrollo mundial
Fuente (organización):
World Bank national accounts data, and OECD National Accounts data files.
Categorías:
Economy & Growth
Se ha actualizado:
23 abr 2017 año
Los indicadores de los cambios de valor en los últimos años
Mínimo:
43.373 bn
1 ene 2003 año
Máximo:
118.868 bn
1 ene 2016 año
A la fecha de observación
Valor
Cambio absoluto
El cambio con respecto al valor anterior
1 ene 2003 año
43.373 bn
+43.373 bn
0.0%
1 ene 2004 año
47.83 bn
+4.457 bn
10.28%
1 ene 2005 año
56.186 bn
+8.356 bn
17.47%
1 ene 2006 año
63.485 bn
+7.3 bn
12.99%
1 ene 2007 año
72.162 bn
+8.677 bn
13.67%
1 ene 2008 año
77.67 bn
+5.508 bn
7.63%
1 ene 2009 año
82.13 bn
+4.46 bn
5.74%
1 ene 2010 año
87.146 bn
+5.016 bn
6.11%
1 ene 2011 año
92.611 bn
+5.465 bn
6.27%
1 ene 2012 año
101.693 bn
+9.083 bn
9.81%
1 ene 2013 año
109.575 bn
+7.882 bn
7.75%
1 ene 2014 año
111.493 bn
+1.918 bn
1.75%
1 ene 2015 año
114.179 bn
+2.686 bn
2.41%
1 ene 2016 año
118.868 bn
+4.689 bn
4.11%
Ranking de los países por los datos estadísticos actuales


Comentarios: