29
/es/
es
AIzaSyAYiBZKx7MnpbEhh9jyipgxe19OcubqV5w
April 1, 2024
234768
Saudi Arabia
SAU
true
2
1
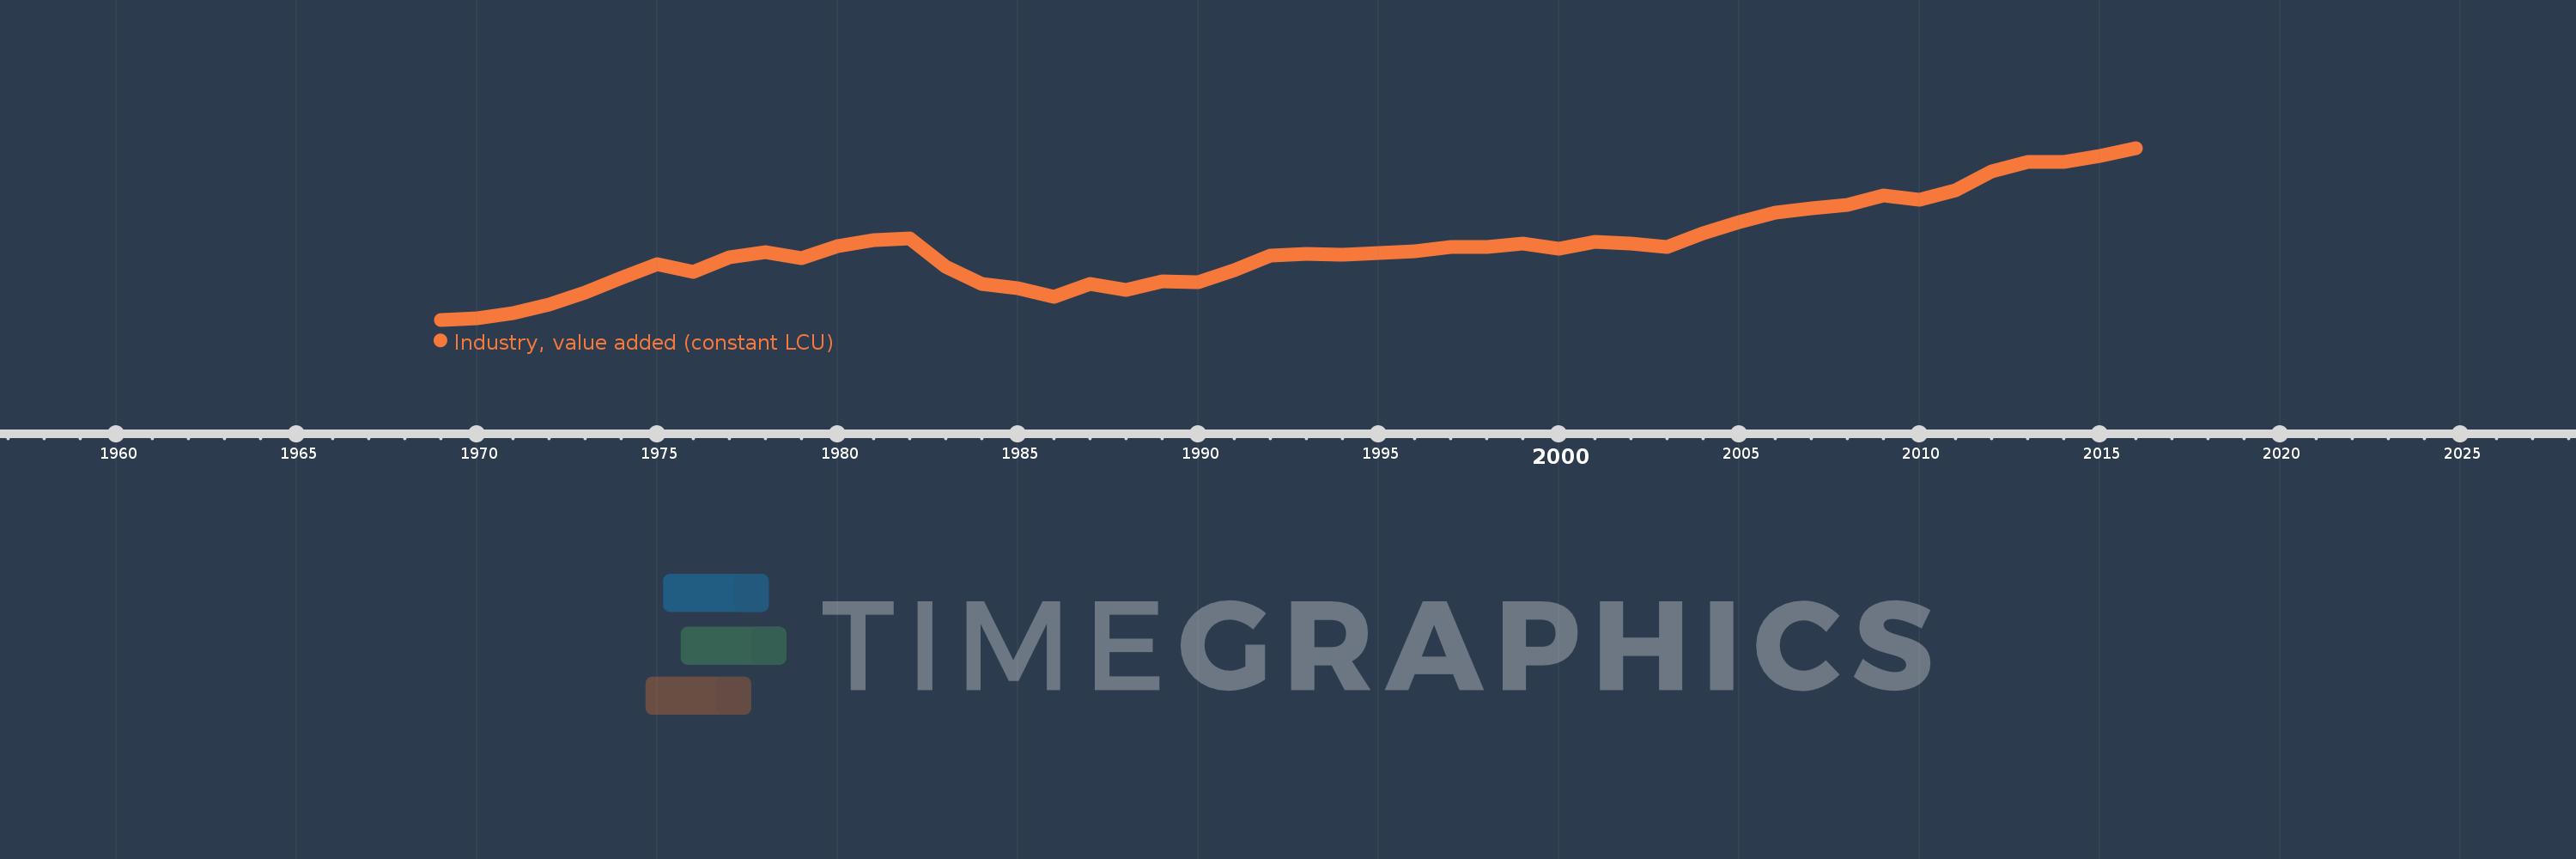
Industry, value added (constant LCU)
2016,2015,2014,2013,2012,2011,2010,2009,2008,2007,2006,2005,2004,2003,2002,2001,2000,1999,1998,1997,1996,1995,1994,1993,1992,1991,1990,1989,1988,1987,1986,1985,1984,1983,1982,1981,1980,1979,1978,1977,1976,1975,1974,1973,1972,1971,1970,1969
Estas estadísticas en otros países:
AfghanistanAlbaniaAlgeriaAntigua and BarbudaArgentinaArmeniaAustraliaAustriaAzerbaijanBahamas, TheBahrainBangladeshBelarusBelgiumBelizeBeninBermudaBhutanBoliviaBosnia and HerzegovinaBotswanaBrazilBrunei DarussalamBulgariaBurkina FasoBurundiCabo VerdeCambodiaCameroonCanadaCayman IslandsCentral African RepublicChadChileChinaColombiaComorosCongo, Dem. Rep.Congo, Rep.Costa RicaCote d'IvoireCroatiaCubaCyprusCzech RepublicDenmarkDjiboutiDominicaDominican RepublicEcuadorEgypt, Arab Rep.El SalvadorEquatorial GuineaEritreaEstoniaEthiopiaFijiFinlandFranceGabonGambia, TheGeorgiaGermanyGhanaGreeceGrenadaGuatemalaGuineaGuinea-BissauGuyanaHaitiHondurasHong Kong SAR, ChinaHungaryIcelandIndiaIndonesiaIran, Islamic Rep.IraqIrelandItalyJamaicaJapanJordanKazakhstanKenyaKiribatiKorea, Rep.KosovoKuwaitKyrgyz RepublicLao PDRLatviaLebanonLesothoLiberiaLithuaniaLuxembourgMacedonia, FYRMadagascarMalawiMalaysiaMaldivesMaliMarshall IslandsMauritaniaMauritiusMexicoMicronesia, Fed. Sts.MoldovaMongoliaMontenegroMoroccoMozambiqueMyanmarNamibiaNepalNetherlandsNew ZealandNicaraguaNigerNigeriaNorwayOmanPakistanPalauPanamaPapua New GuineaParaguayPeruPhilippinesPolandPortugalPuerto RicoQatarRomaniaRussian FederationRwandaSamoaSao Tome and PrincipeSaudi ArabiaSenegalSerbiaSeychellesSierra LeoneSingaporeSlovak RepublicSloveniaSolomon IslandsSomaliaSouth AfricaSpainSri LankaSt. Kitts and NevisSt. LuciaSt. Vincent and the GrenadinesSudanSurinameSwazilandSwedenSwitzerlandSyrian Arab RepublicTajikistanTanzaniaThailandTimor-LesteTogoTongaTrinidad and TobagoTunisiaTurkeyTurkmenistanTuvaluUgandaUkraineUnited Arab EmiratesUnited KingdomUnited StatesUruguayUzbekistanVanuatuVenezuela, RBVietnamWest Bank and GazaZambiaZimbabwe línea de tiempo (timeline):
En esta escala de tiempo se presenta un gráfico de 1969 y 2016 de Saudi Arabia. Los datos de 1968 están ausentes. El número de observaciones reales por fecha: 48.
Fuente (nombre):
Indicadores del desarrollo mundial
Fuente (organización):
World Bank national accounts data, and OECD National Accounts data files.
Categorías:
Economy & Growth
Se ha actualizado:
23 abr 2017 año
Los indicadores de los cambios de valor en los últimos años
Mínimo:
227.733 bn
1 ene 1969 año
Máximo:
1.46 billones
1 ene 2016 año
A la fecha de observación
Valor
Cambio absoluto
El cambio con respecto al valor anterior
1 ene 1969 año
227.733 bn
+227.733 bn
0.0%
1 ene 1970 año
239.162 bn
+11.428 bn
5.02%
1 ene 1971 año
277.468 bn
+38.307 bn
16.02%
1 ene 1972 año
337.332 bn
+59.864 bn
21.58%
1 ene 1973 año
421.122 bn
+83.79 bn
24.84%
1 ene 1974 año
530.053 bn
+108.93 bn
25.87%
1 ene 1975 año
625.676 bn
+95.624 bn
18.04%
1 ene 1976 año
569.271 bn
-56.405 bn
-9.02%
1 ene 1977 año
675.052 bn
+105.781 bn
18.58%
1 ene 1978 año
713.687 bn
+38.635 bn
5.72%
1 ene 1979 año
668.352 bn
-45.336 bn
-6.35%
1 ene 1980 año
756.83 bn
+88.479 bn
13.24%
1 ene 1981 año
800.283 bn
+43.453 bn
5.74%
1 ene 1982 año
813.245 bn
+12.963 bn
1.62%
1 ene 1983 año
610.497 bn
-202.748 bn
-24.93%
1 ene 1984 año
484.195 bn
-126.302 bn
-20.69%
1 ene 1985 año
450.866 bn
-33.329 bn
-6.88%
1 ene 1986 año
395.194 bn
-55.671 bn
-12.35%
1 ene 1987 año
482.955 bn
+87.76 bn
22.21%
1 ene 1988 año
442.153 bn
-40.802 bn
-8.45%
1 ene 1989 año
504.429 bn
+62.277 bn
14.08%
1 ene 1990 año
497.238 bn
-7.192 bn
-1.43%
1 ene 1991 año
581.198 bn
+83.961 bn
16.89%
1 ene 1992 año
685.481 bn
+104.283 bn
17.94%
1 ene 1993 año
702.662 bn
+17.181 bn
2.51%
1 ene 1994 año
692.159 bn
-10.503 bn
-1.49%
1 ene 1995 año
704.587 bn
+12.428 bn
1.8%
1 ene 1996 año
720.027 bn
+15.44 bn
2.19%
1 ene 1997 año
751.718 bn
+31.691 bn
4.4%
1 ene 1998 año
752.405 bn
+687.169 millones
0.09%
1 ene 1999 año
775.034 bn
+22.629 bn
3.01%
1 ene 2000 año
738.747 bn
-36.287 bn
-4.68%
1 ene 2001 año
786.951 bn
+48.203 bn
6.53%
1 ene 2002 año
775.683 bn
-11.268 bn
-1.43%
1 ene 2003 año
746.864 bn
-28.819 bn
-3.72%
1 ene 2004 año
845.536 bn
+98.672 bn
13.21%
1 ene 2005 año
928.461 bn
+82.925 bn
9.81%
1 ene 2006 año
993.984 bn
+65.524 bn
7.06%
1 ene 2007 año
1.028 billones
+34.011 bn
3.42%
1 ene 2008 año
1.054 billones
+25.835 bn
2.51%
1 ene 2009 año
1.117 billones
+63.455 bn
6.02%
1 ene 2010 año
1.089 billones
-28.72 bn
-2.57%
1 ene 2011 año
1.156 billones
+67.895 bn
6.24%
1 ene 2012 año
1.295 billones
+138.288 bn
11.96%
1 ene 2013 año
1.359 billones
+63.89 bn
4.93%
1 ene 2014 año
1.362 billones
+3.021 bn
0.22%
1 ene 2015 año
1.404 billones
+42.551 bn
3.12%
1 ene 2016 año
1.46 billones
+56.0 bn
3.99%
Ranking de los países por los datos estadísticos actuales


Comentarios: