29
/es/
es
AIzaSyAYiBZKx7MnpbEhh9jyipgxe19OcubqV5w
April 1, 2024
135671
Gabon
GAB
true
2
1
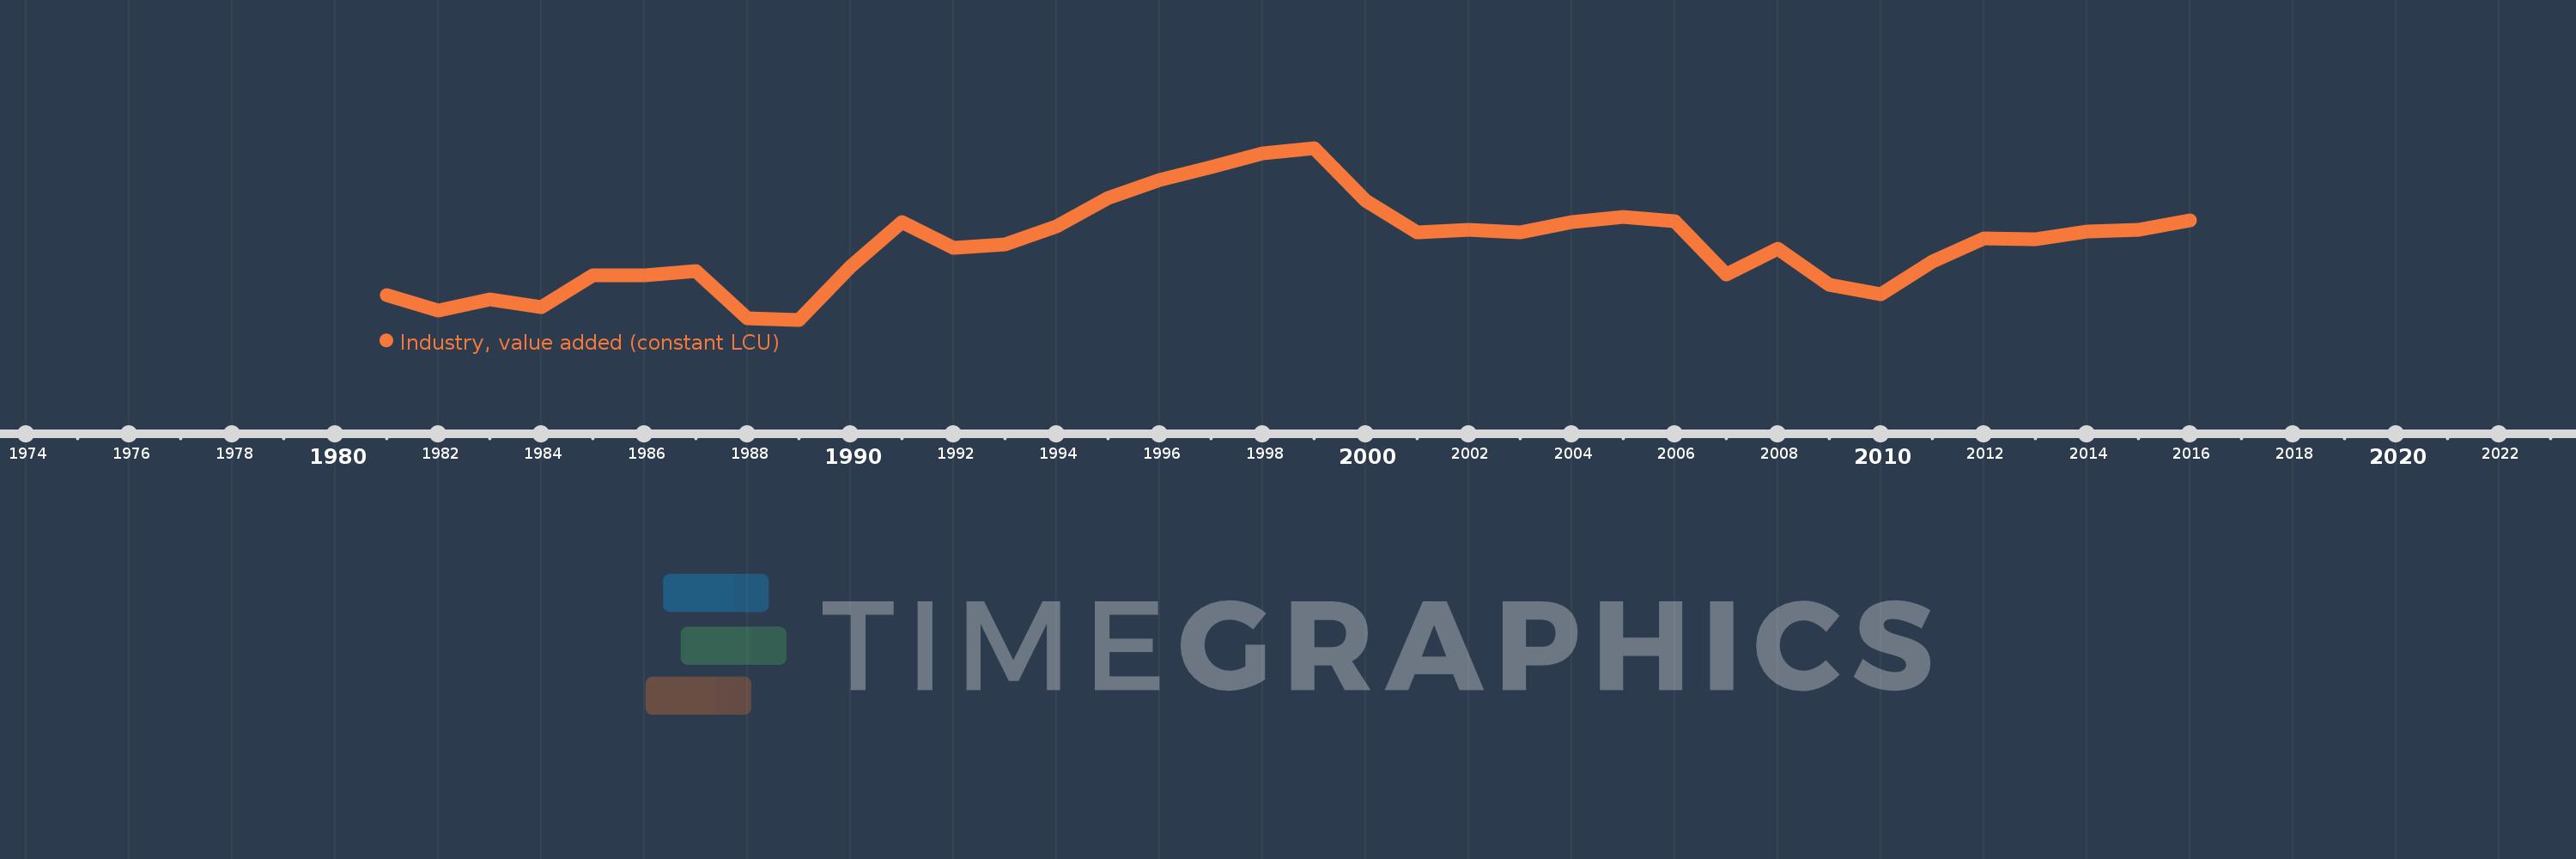
Industry, value added (constant LCU)
2016,2015,2014,2013,2012,2011,2010,2009,2008,2007,2006,2005,2004,2003,2002,2001,2000,1999,1998,1997,1996,1995,1994,1993,1992,1991,1990,1989,1988,1987,1986,1985,1984,1983,1982,1981
Estas estadísticas en otros países:
AfghanistanAlbaniaAlgeriaAntigua and BarbudaArgentinaArmeniaAustraliaAustriaAzerbaijanBahamas, TheBahrainBangladeshBelarusBelgiumBelizeBeninBermudaBhutanBoliviaBosnia and HerzegovinaBotswanaBrazilBrunei DarussalamBulgariaBurkina FasoBurundiCabo VerdeCambodiaCameroonCanadaCayman IslandsCentral African RepublicChadChileChinaColombiaComorosCongo, Dem. Rep.Congo, Rep.Costa RicaCote d'IvoireCroatiaCubaCyprusCzech RepublicDenmarkDjiboutiDominicaDominican RepublicEcuadorEgypt, Arab Rep.El SalvadorEquatorial GuineaEritreaEstoniaEthiopiaFijiFinlandFranceGabonGambia, TheGeorgiaGermanyGhanaGreeceGrenadaGuatemalaGuineaGuinea-BissauGuyanaHaitiHondurasHong Kong SAR, ChinaHungaryIcelandIndiaIndonesiaIran, Islamic Rep.IraqIrelandItalyJamaicaJapanJordanKazakhstanKenyaKiribatiKorea, Rep.KosovoKuwaitKyrgyz RepublicLao PDRLatviaLebanonLesothoLiberiaLithuaniaLuxembourgMacedonia, FYRMadagascarMalawiMalaysiaMaldivesMaliMarshall IslandsMauritaniaMauritiusMexicoMicronesia, Fed. Sts.MoldovaMongoliaMontenegroMoroccoMozambiqueMyanmarNamibiaNepalNetherlandsNew ZealandNicaraguaNigerNigeriaNorwayOmanPakistanPalauPanamaPapua New GuineaParaguayPeruPhilippinesPolandPortugalPuerto RicoQatarRomaniaRussian FederationRwandaSamoaSao Tome and PrincipeSaudi ArabiaSenegalSerbiaSeychellesSierra LeoneSingaporeSlovak RepublicSloveniaSolomon IslandsSomaliaSouth AfricaSpainSri LankaSt. Kitts and NevisSt. LuciaSt. Vincent and the GrenadinesSudanSurinameSwazilandSwedenSwitzerlandSyrian Arab RepublicTajikistanTanzaniaThailandTimor-LesteTogoTongaTrinidad and TobagoTunisiaTurkeyTurkmenistanTuvaluUgandaUkraineUnited Arab EmiratesUnited KingdomUnited StatesUruguayUzbekistanVanuatuVenezuela, RBVietnamWest Bank and GazaZambiaZimbabwe línea de tiempo (timeline):
En esta escala de tiempo se presenta un gráfico de 1981 y 2016 de Gabon. Los datos de 1980 están ausentes. El número de observaciones reales por fecha: 36.
Fuente (nombre):
Indicadores del desarrollo mundial
Fuente (organización):
World Bank national accounts data, and OECD National Accounts data files.
Categorías:
Economy & Growth
Se ha actualizado:
23 abr 2017 año
Los indicadores de los cambios de valor en los últimos años
En promedio:
1.674 billones
Mínimo:
1.248 billones
1 ene 1989 año
Máximo:
2.221 billones
1 ene 1999 año
A la fecha de observación
Valor
Cambio absoluto
El cambio con respecto al valor anterior
1 ene 1981 año
1.39 billones
+1.39 billones
0.0%
1 ene 1982 año
1.299 billones
-91.344 bn
-6.57%
1 ene 1983 año
1.362 billones
+63.332 bn
4.88%
1 ene 1984 año
1.319 billones
-42.384 bn
-3.11%
1 ene 1985 año
1.498 billones
+178.06 bn
13.49%
1 ene 1986 año
1.5 billones
+1.949 bn
0.13%
1 ene 1987 año
1.526 billones
+26.307 bn
1.75%
1 ene 1988 año
1.254 billones
-271.84 bn
-17.82%
1 ene 1989 año
1.248 billones
-5.846 bn
-0.47%
1 ene 1990 año
1.547 billones
+298.878 bn
23.95%
1 ene 1991 año
1.802 billones
+255.033 bn
16.49%
1 ene 1992 año
1.656 billones
-145.712 bn
-8.09%
1 ene 1993 año
1.674 billones
+17.343 bn
1.05%
1 ene 1994 año
1.779 billones
+104.985 bn
6.27%
1 ene 1995 año
1.94 billones
+161.009 bn
9.05%
1 ene 1996 año
2.041 billones
+101.575 bn
5.24%
1 ene 1997 año
2.114 billones
+72.832 bn
3.57%
1 ene 1998 año
2.191 billones
+77.216 bn
3.65%
1 ene 1999 año
2.221 billones
+29.474 bn
1.35%
1 ene 2000 año
1.921 billones
-300.096 bn
-13.51%
1 ene 2001 año
1.741 billones
-180.009 bn
-9.37%
1 ene 2002 año
1.755 billones
+14.615 bn
0.84%
1 ene 2003 año
1.745 billones
-10.579 bn
-0.6%
1 ene 2004 año
1.803 billones
+58.521 bn
3.35%
1 ene 2005 año
1.828 billones
+25.227 bn
1.4%
1 ene 2006 año
1.805 billones
-23.021 bn
-1.26%
1 ene 2007 año
1.506 billones
-298.944 bn
-16.56%
1 ene 2008 año
1.653 billones
+146.039 bn
9.69%
1 ene 2009 año
1.446 billones
-206.788 bn
-12.51%
1 ene 2010 año
1.394 billones
-52.058 bn
-3.6%
1 ene 2011 año
1.578 billones
+184.224 bn
13.22%
1 ene 2012 año
1.708 billones
+130.448 bn
8.27%
1 ene 2013 año
1.706 billones
-2.156 bn
-0.13%
1 ene 2014 año
1.747 billones
+41.218 bn
2.42%
1 ene 2015 año
1.758 billones
+10.653 bn
0.61%
1 ene 2016 año
1.809 billones
+51.357 bn
2.92%
Ranking de los países por los datos estadísticos actuales


Comentarios: