29
/es/
es
AIzaSyAYiBZKx7MnpbEhh9jyipgxe19OcubqV5w
April 1, 2024
194377
Mauritius
MUS
true
2
1
Industry, value added (constant LCU)
2016,2015,2014,2013,2012,2011,2010,2009,2008,2007,2006,2005,2004,2003,2002,2001,2000,1999,1998,1997,1996,1995,1994,1993,1992,1991,1990,1989,1988,1987,1986,1985,1984,1983,1982,1981,1980,1979,1978,1977
Estas estadísticas en otros países:
AfghanistanAlbaniaAlgeriaAntigua and BarbudaArgentinaArmeniaAustraliaAustriaAzerbaijanBahamas, TheBahrainBangladeshBelarusBelgiumBelizeBeninBermudaBhutanBoliviaBosnia and HerzegovinaBotswanaBrazilBrunei DarussalamBulgariaBurkina FasoBurundiCabo VerdeCambodiaCameroonCanadaCayman IslandsCentral African RepublicChadChileChinaColombiaComorosCongo, Dem. Rep.Congo, Rep.Costa RicaCote d'IvoireCroatiaCubaCyprusCzech RepublicDenmarkDjiboutiDominicaDominican RepublicEcuadorEgypt, Arab Rep.El SalvadorEquatorial GuineaEritreaEstoniaEthiopiaFijiFinlandFranceGabonGambia, TheGeorgiaGermanyGhanaGreeceGrenadaGuatemalaGuineaGuinea-BissauGuyanaHaitiHondurasHong Kong SAR, ChinaHungaryIcelandIndiaIndonesiaIran, Islamic Rep.IraqIrelandItalyJamaicaJapanJordanKazakhstanKenyaKiribatiKorea, Rep.KosovoKuwaitKyrgyz RepublicLao PDRLatviaLebanonLesothoLiberiaLithuaniaLuxembourgMacedonia, FYRMadagascarMalawiMalaysiaMaldivesMaliMarshall IslandsMauritaniaMauritiusMexicoMicronesia, Fed. Sts.MoldovaMongoliaMontenegroMoroccoMozambiqueMyanmarNamibiaNepalNetherlandsNew ZealandNicaraguaNigerNigeriaNorwayOmanPakistanPalauPanamaPapua New GuineaParaguayPeruPhilippinesPolandPortugalPuerto RicoQatarRomaniaRussian FederationRwandaSamoaSao Tome and PrincipeSaudi ArabiaSenegalSerbiaSeychellesSierra LeoneSingaporeSlovak RepublicSloveniaSolomon IslandsSomaliaSouth AfricaSpainSri LankaSt. Kitts and NevisSt. LuciaSt. Vincent and the GrenadinesSudanSurinameSwazilandSwedenSwitzerlandSyrian Arab RepublicTajikistanTanzaniaThailandTimor-LesteTogoTongaTrinidad and TobagoTunisiaTurkeyTurkmenistanTuvaluUgandaUkraineUnited Arab EmiratesUnited KingdomUnited StatesUruguayUzbekistanVanuatuVenezuela, RBVietnamWest Bank and GazaZambiaZimbabwe línea de tiempo (timeline):
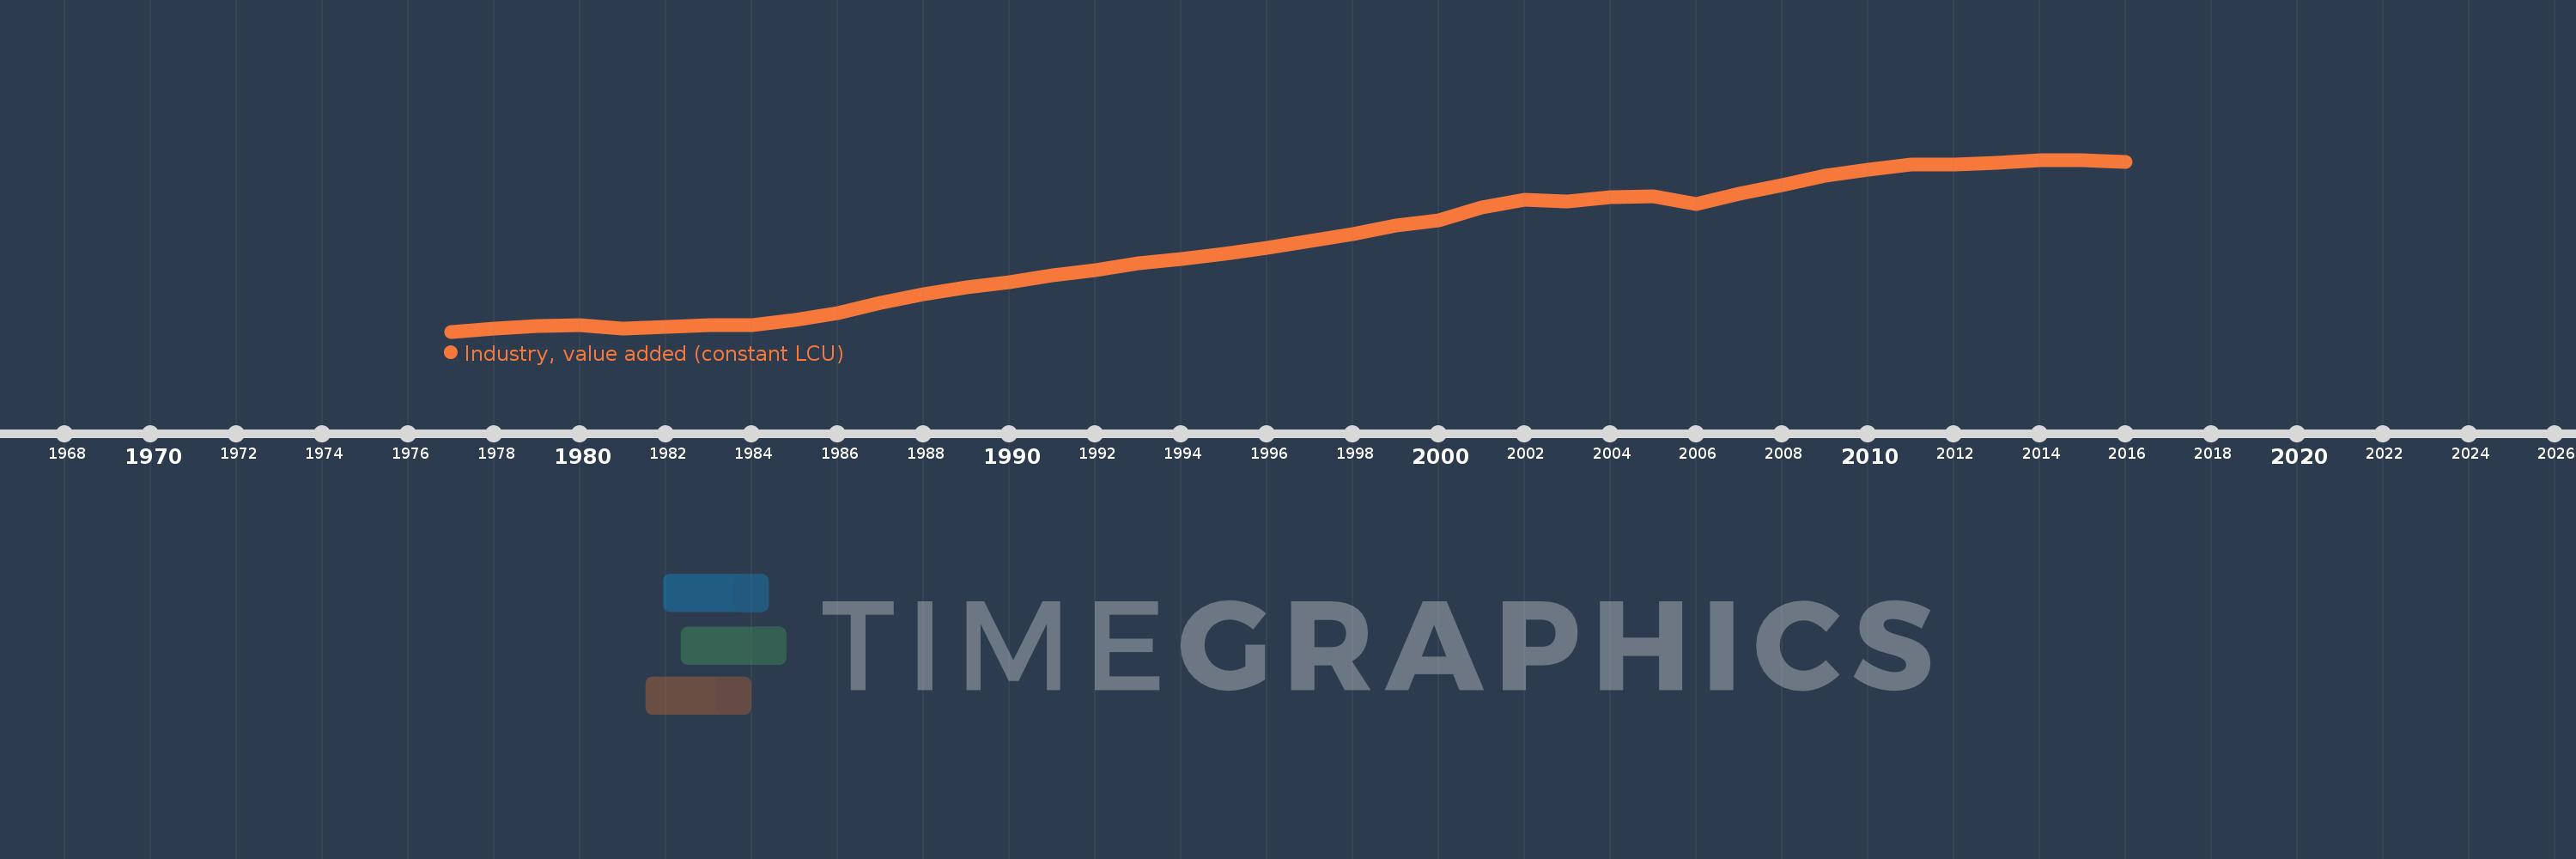
En esta escala de tiempo se presenta un gráfico de 1977 y 2016 de Mauritius. Los datos de 1976 están ausentes. El número de observaciones reales por fecha: 40.
Fuente (nombre):
Indicadores del desarrollo mundial
Fuente (organización):
World Bank national accounts data, and OECD National Accounts data files.
Categorías:
Economy & Growth
Se ha actualizado:
23 abr 2017 año
Los indicadores de los cambios de valor en los últimos años
Mínimo:
10.759 bn
1 ene 1977 año
Máximo:
59.519 bn
1 ene 2014 año
A la fecha de observación
Valor
Cambio absoluto
El cambio con respecto al valor anterior
1 ene 1977 año
10.759 bn
+10.759 bn
0.0%
1 ene 1978 año
11.636 bn
+877.712 millones
8.16%
1 ene 1979 año
12.446 bn
+809.996 millones
6.96%
1 ene 1980 año
12.681 bn
+234.903 millones
1.89%
1 ene 1981 año
11.525 bn
-1.156 bn
-9.12%
1 ene 1982 año
12.127 bn
+601.496 millones
5.22%
1 ene 1983 año
12.614 bn
+487.016 millones
4.02%
1 ene 1984 año
12.699 bn
+85.52 millones
0.68%
1 ene 1985 año
13.983 bn
+1.284 bn
10.11%
1 ene 1986 año
15.95 bn
+1.967 bn
14.07%
1 ene 1987 año
18.808 bn
+2.858 bn
17.92%
1 ene 1988 año
21.308 bn
+2.5 bn
13.29%
1 ene 1989 año
23.225 bn
+1.918 bn
9.0%
1 ene 1990 año
24.665 bn
+1.44 bn
6.2%
1 ene 1991 año
26.706 bn
+2.041 bn
8.27%
1 ene 1992 año
28.106 bn
+1.4 bn
5.24%
1 ene 1993 año
30.067 bn
+1.961 bn
6.98%
1 ene 1994 año
31.466 bn
+1.399 bn
4.65%
1 ene 1995 año
32.909 bn
+1.443 bn
4.59%
1 ene 1996 año
34.427 bn
+1.518 bn
4.61%
1 ene 1997 año
36.568 bn
+2.14 bn
6.22%
1 ene 1998 año
38.368 bn
+1.8 bn
4.92%
1 ene 1999 año
40.919 bn
+2.551 bn
6.65%
1 ene 2000 año
42.346 bn
+1.427 bn
3.49%
1 ene 2001 año
45.87 bn
+3.524 bn
8.32%
1 ene 2002 año
48.108 bn
+2.238 bn
4.88%
1 ene 2003 año
47.703 bn
-405.435 millones
-0.84%
1 ene 2004 año
48.841 bn
+1.138 bn
2.39%
1 ene 2005 año
49.196 bn
+355.318 millones
0.73%
1 ene 2006 año
46.893 bn
-2.303 bn
-4.68%
1 ene 2007 año
49.781 bn
+2.888 bn
6.16%
1 ene 2008 año
52.359 bn
+2.578 bn
5.18%
1 ene 2009 año
55.014 bn
+2.655 bn
5.07%
1 ene 2010 año
56.663 bn
+1.649 bn
3.0%
1 ene 2011 año
58.159 bn
+1.496 bn
2.64%
1 ene 2012 año
58.158 bn
-169.568 mil
0.0%
1 ene 2013 año
58.641 bn
+483.029 millones
0.83%
1 ene 2014 año
59.519 bn
+877.263 millones
1.5%
1 ene 2015 año
59.328 bn
-191.012 millones
-0.32%
1 ene 2016 año
58.901 bn
-426.793 millones
-0.72%
Ranking de los países por los datos estadísticos actuales


Comentarios: