29
/es/
es
AIzaSyAYiBZKx7MnpbEhh9jyipgxe19OcubqV5w
April 1, 2024
62609
World
WLD
false
2
1
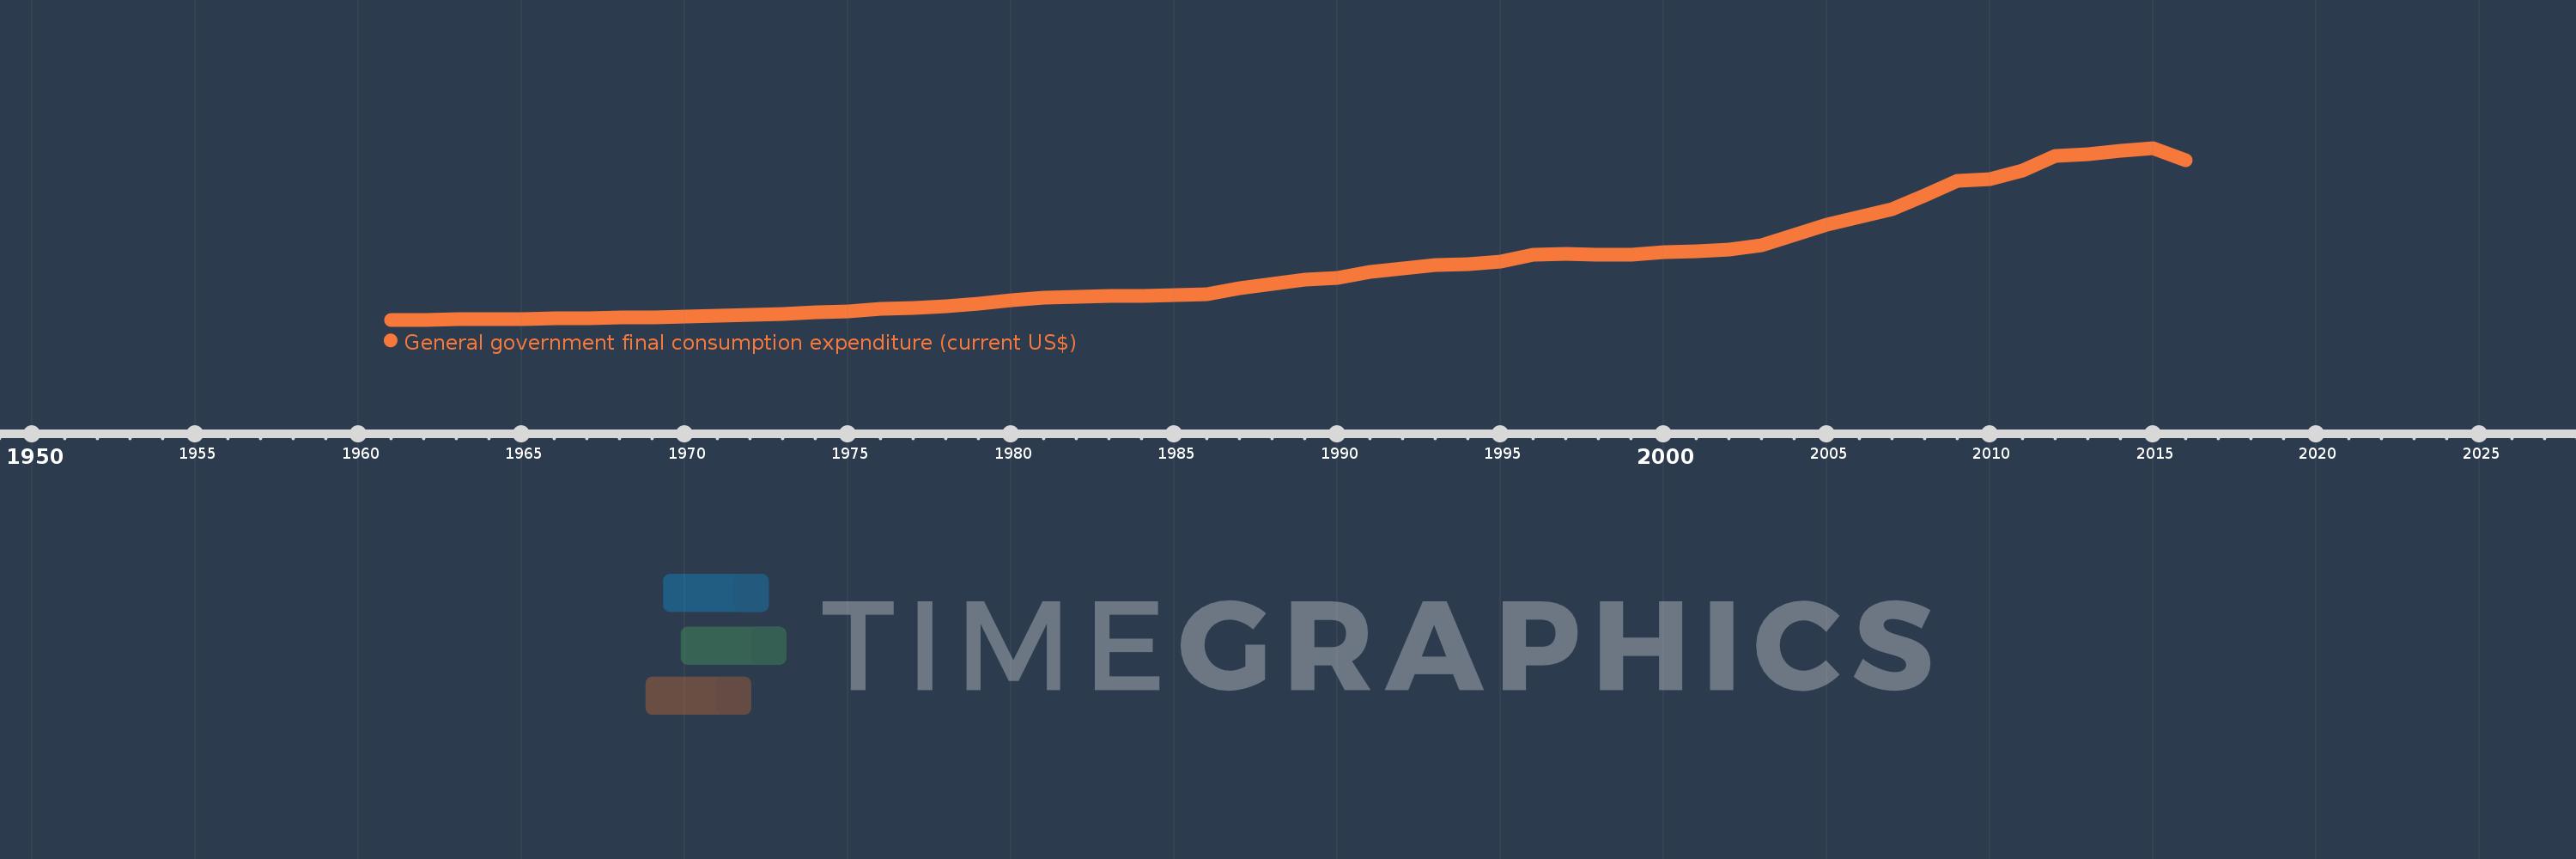
General government final consumption expenditure (current US$)
2016,2015,2014,2013,2012,2011,2010,2009,2008,2007,2006,2005,2004,2003,2002,2001,2000,1999,1998,1997,1996,1995,1994,1993,1992,1991,1990,1989,1988,1987,1986,1985,1984,1983,1982,1981,1980,1979,1978,1977,1976,1975,1974,1973,1972,1971,1970,1969,1968,1967,1966,1965,1964,1963,1962,1961
Estas estadísticas en otros países:
AfghanistanAlbaniaAlgeriaAngolaAntigua and BarbudaArab WorldArgentinaArmeniaArubaAustraliaAustriaAzerbaijanBahamas, TheBahrainBangladeshBarbadosBelarusBelgiumBelizeBeninBermudaBhutanBoliviaBosnia and HerzegovinaBotswanaBrazilBrunei DarussalamBulgariaBurkina FasoBurundiCabo VerdeCambodiaCameroonCanadaCaribbean small statesCentral African RepublicCentral Europe and the BalticsChadChileChinaColombiaComorosCongo, Dem. Rep.Congo, Rep.Costa RicaCote d'IvoireCroatiaCubaCyprusCzech RepublicDenmarkDjiboutiDominicaDominican RepublicEarly-demographic dividendEast Asia & PacificEast Asia & Pacific (excluding high income)East Asia & Pacific (IDA & IBRD countries)EcuadorEgypt, Arab Rep.El SalvadorEquatorial GuineaEritreaEstoniaEthiopiaEuro areaEurope & Central AsiaEurope & Central Asia (excluding high income)Europe & Central Asia (IDA & IBRD countries)European UnionFaroe IslandsFijiFinlandFragile and conflict affected situationsFranceFrench PolynesiaGabonGambia, TheGeorgiaGermanyGhanaGreeceGrenadaGuatemalaGuineaGuinea-BissauGuyanaHaitiHeavily indebted poor countries (HIPC)High incomeHondurasHong Kong SAR, ChinaHungaryIBRD onlyIcelandIDA & IBRD totalIDA blendIDA onlyIDA totalIndiaIndonesiaIran, Islamic Rep.IraqIrelandIsraelItalyJamaicaJapanJordanKazakhstanKenyaKiribatiKorea, Rep.KosovoKuwaitKyrgyz RepublicLao PDRLate-demographic dividendLatin America & Caribbean Latin America & Caribbean (excluding high income)Latin America & the Caribbean (IDA & IBRD countries)LatviaLeast developed countries: UN classificationLebanonLesothoLiberiaLibyaLithuaniaLow & middle incomeLow incomeLower middle incomeLuxembourgMacao SAR, ChinaMacedonia, FYRMadagascarMalawiMalaysiaMaldivesMaliMaltaMauritaniaMauritiusMexicoMicronesia, Fed. Sts.Middle East & North AfricaMiddle East & North Africa (excluding high income)Middle East & North Africa (IDA & IBRD countries)Middle incomeMoldovaMongoliaMontenegroMoroccoMozambiqueNamibiaNepalNetherlandsNew CaledoniaNew ZealandNicaraguaNigerNigeriaNorth AmericaNorwayOECD membersOmanOther small statesPakistanPanamaPapua New GuineaParaguayPeruPhilippinesPolandPortugalPost-demographic dividendPre-demographic dividendPuerto RicoQatarRomaniaRussian FederationRwandaSaudi ArabiaSenegalSerbiaSeychellesSierra LeoneSingaporeSlovak RepublicSloveniaSmall statesSolomon IslandsSomaliaSouth AfricaSouth AsiaSouth Asia (IDA & IBRD)South SudanSpainSri LankaSt. Kitts and NevisSt. LuciaSt. Vincent and the GrenadinesSub-Saharan Africa Sub-Saharan Africa (excluding high income)Sub-Saharan Africa (IDA & IBRD countries)SudanSurinameSwazilandSwedenSwitzerlandSyrian Arab RepublicTajikistanTanzaniaThailandTimor-LesteTogoTongaTrinidad and TobagoTunisiaTurkeyTurkmenistanUgandaUkraineUnited Arab EmiratesUnited KingdomUnited StatesUpper middle incomeUruguayUzbekistanVanuatuVenezuela, RBVietnamWest Bank and GazaWorldYemen, Rep.ZambiaZimbabwe línea de tiempo (timeline):
En esta escala de tiempo se presenta un gráfico de 1961 y 2016 de World. Los datos de 1960 están ausentes. El número de observaciones reales por fecha: 56.
Fuente (nombre):
Indicadores del desarrollo mundial
Fuente (organización):
World Bank national accounts data, and OECD National Accounts data files.
Categorías:
Economy & Growth
Se ha actualizado:
23 abr 2017 año
Los indicadores de los cambios de valor en los últimos años
Mínimo:
191.485 bn
1 ene 1961 año
Máximo:
13.082 billones
1 ene 2015 año
A la fecha de observación
Valor
Cambio absoluto
El cambio con respecto al valor anterior
1 ene 1961 año
191.485 bn
+191.485 bn
0.0%
1 ene 1962 año
203.705 bn
+12.22 bn
6.38%
1 ene 1963 año
221.461 bn
+17.756 bn
8.72%
1 ene 1964 año
241.207 bn
+19.745 bn
8.92%
1 ene 1965 año
259.636 bn
+18.429 bn
7.64%
1 ene 1966 año
283.732 bn
+24.096 bn
9.28%
1 ene 1967 año
316.258 bn
+32.526 bn
11.46%
1 ene 1968 año
350.344 bn
+34.086 bn
10.78%
1 ene 1969 año
384.06 bn
+33.717 bn
9.62%
1 ene 1970 año
420.205 bn
+36.145 bn
9.41%
1 ene 1971 año
464.687 bn
+44.482 bn
10.59%
1 ene 1972 año
527.348 bn
+62.661 bn
13.48%
1 ene 1973 año
607.541 bn
+80.193 bn
15.21%
1 ene 1974 año
720.836 bn
+113.296 bn
18.65%
1 ene 1975 año
847.906 bn
+127.07 bn
17.63%
1 ene 1976 año
1.006 billones
+157.878 bn
18.62%
1 ene 1977 año
1.074 billones
+67.909 bn
6.75%
1 ene 1978 año
1.203 billones
+129.048 bn
12.02%
1 ene 1979 año
1.417 billones
+214.156 bn
17.81%
1 ene 1980 año
1.63 billones
+212.991 bn
15.03%
1 ene 1981 año
1.869 billones
+239.206 bn
14.68%
1 ene 1982 año
1.925 billones
+55.815 bn
2.99%
1 ene 1983 año
1.954 billones
+29.543 bn
1.53%
1 ene 1984 año
2.001 billones
+46.681 bn
2.39%
1 ene 1985 año
2.019 billones
+17.54 bn
0.88%
1 ene 1986 año
2.122 billones
+103.053 bn
5.11%
1 ene 1987 año
2.539 billones
+417.193 bn
19.66%
1 ene 1988 año
2.898 billones
+358.984 bn
14.14%
1 ene 1989 año
3.171 billones
+272.61 bn
9.41%
1 ene 1990 año
3.308 billones
+137.012 bn
4.32%
1 ene 1991 año
3.774 billones
+466.125 bn
14.09%
1 ene 1992 año
4.03 billones
+255.888 bn
6.78%
1 ene 1993 año
4.293 billones
+263.763 bn
6.55%
1 ene 1994 año
4.36 billones
+66.742 bn
1.55%
1 ene 1995 año
4.582 billones
+222.407 bn
5.1%
1 ene 1996 año
5.078 billones
+495.347 bn
10.81%
1 ene 1997 año
5.161 billones
+83.113 bn
1.64%
1 ene 1998 año
5.075 billones
-86.396 bn
-1.67%
1 ene 1999 año
5.059 billones
-15.049 bn
-0.3%
1 ene 2000 año
5.248 billones
+188.435 bn
3.72%
1 ene 2001 año
5.353 billones
+105.048 bn
2.0%
1 ene 2002 año
5.446 billones
+93.412 bn
1.75%
1 ene 2003 año
5.783 billones
+336.855 bn
6.18%
1 ene 2004 año
6.583 billones
+800.197 bn
13.84%
1 ene 2005 año
7.356 billones
+772.226 bn
11.73%
1 ene 2006 año
7.906 billones
+550.366 bn
7.48%
1 ene 2007 año
8.484 billones
+577.917 bn
7.31%
1 ene 2008 año
9.49 billones
+1.006 billones
11.85%
1 ene 2009 año
10.643 billones
+1.153 billones
12.15%
1 ene 2010 año
10.747 billones
+104.478 bn
0.98%
1 ene 2011 año
11.416 billones
+668.707 bn
6.22%
1 ene 2012 año
12.466 billones
+1.05 billones
9.2%
1 ene 2013 año
12.594 billones
+128.375 bn
1.03%
1 ene 2014 año
12.896 billones
+301.927 bn
2.4%
1 ene 2015 año
13.082 billones
+186.003 bn
1.44%
1 ene 2016 año
12.145 billones
-937.022 bn
-7.16%
Ranking de los países por los datos estadísticos actuales


Comentarios: