29
/es/
es
AIzaSyAYiBZKx7MnpbEhh9jyipgxe19OcubqV5w
April 1, 2024
247560
Spain
ESP
true
2
1
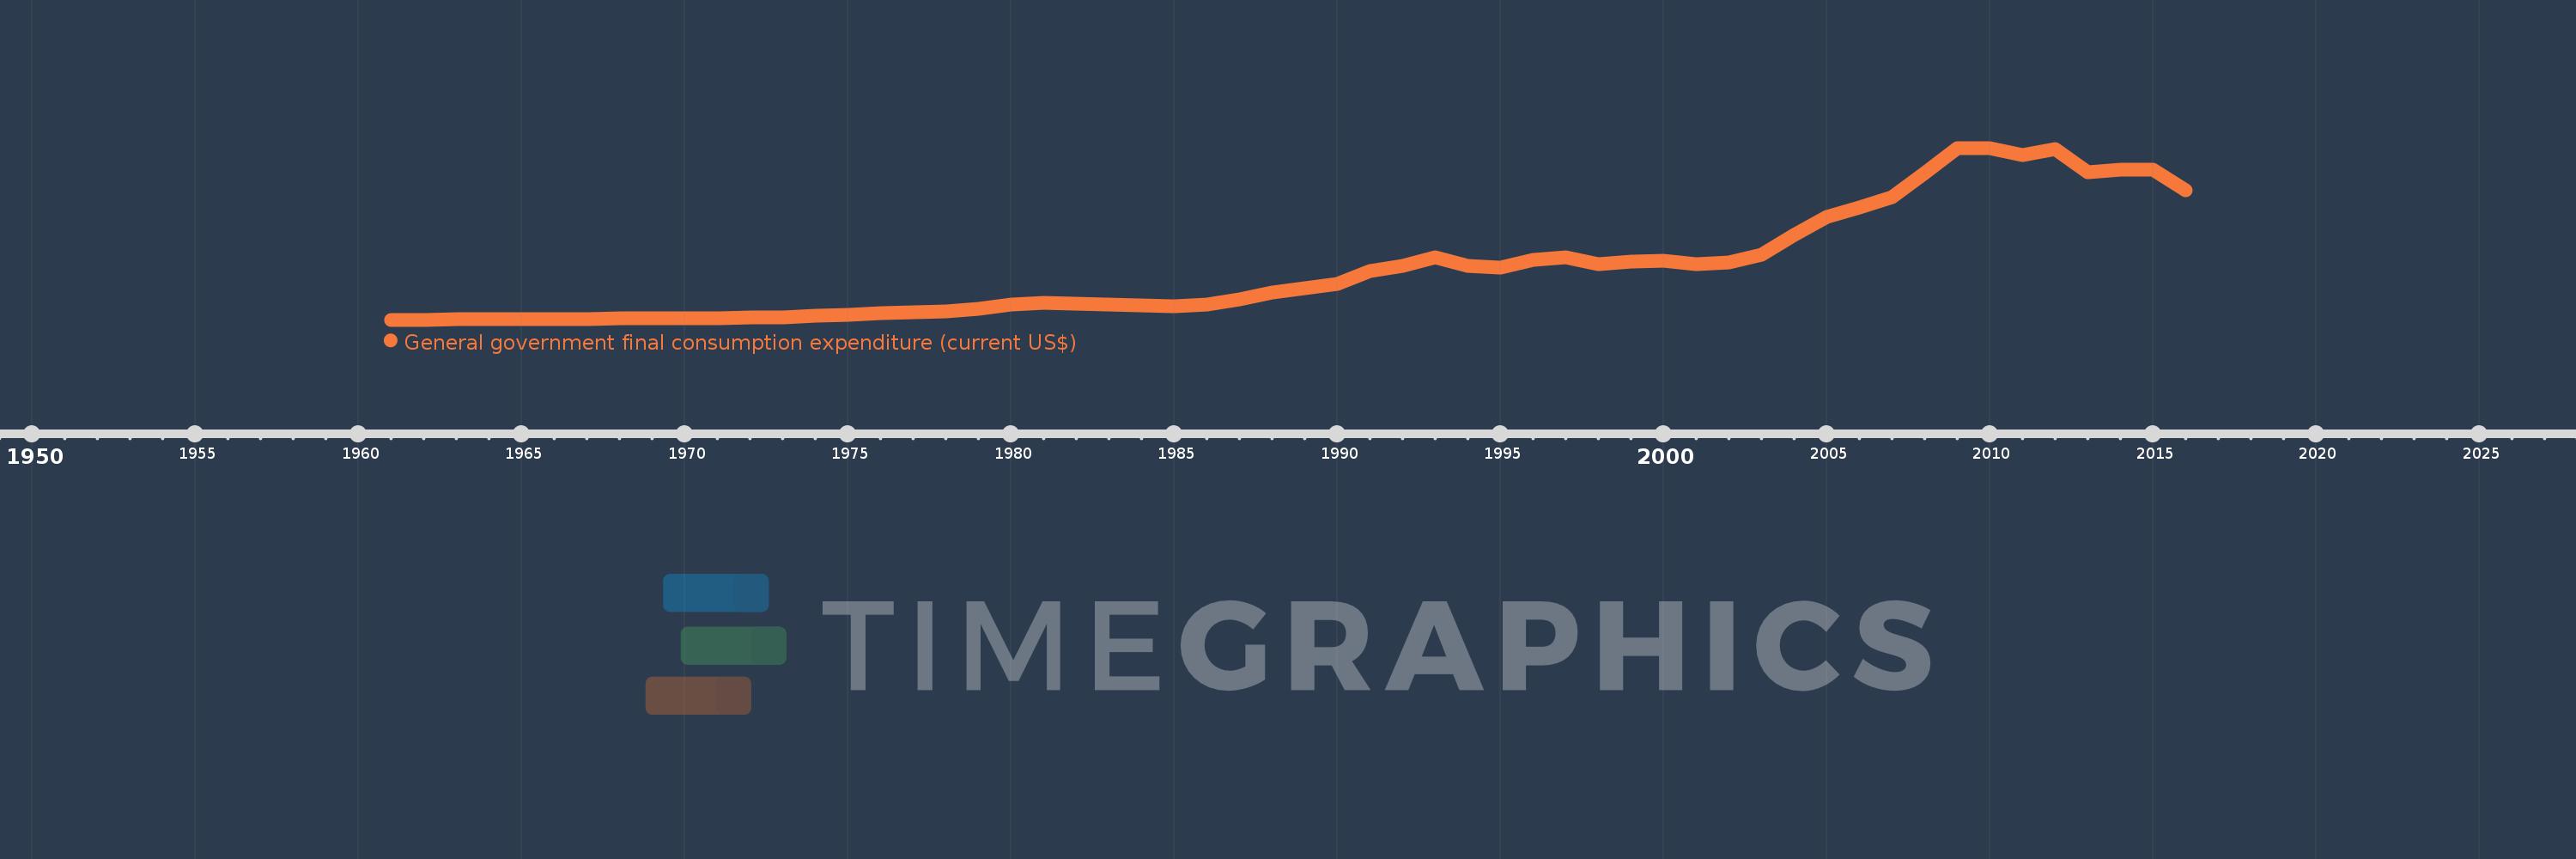
General government final consumption expenditure (current US$)
2016,2015,2014,2013,2012,2011,2010,2009,2008,2007,2006,2005,2004,2003,2002,2001,2000,1999,1998,1997,1996,1995,1994,1993,1992,1991,1990,1989,1988,1987,1986,1985,1984,1983,1982,1981,1980,1979,1978,1977,1976,1975,1974,1973,1972,1971,1970,1969,1968,1967,1966,1965,1964,1963,1962,1961
Estas estadísticas en otros países:
AfghanistanAlbaniaAlgeriaAngolaAntigua and BarbudaArab WorldArgentinaArmeniaArubaAustraliaAustriaAzerbaijanBahamas, TheBahrainBangladeshBarbadosBelarusBelgiumBelizeBeninBermudaBhutanBoliviaBosnia and HerzegovinaBotswanaBrazilBrunei DarussalamBulgariaBurkina FasoBurundiCabo VerdeCambodiaCameroonCanadaCaribbean small statesCentral African RepublicCentral Europe and the BalticsChadChileChinaColombiaComorosCongo, Dem. Rep.Congo, Rep.Costa RicaCote d'IvoireCroatiaCubaCyprusCzech RepublicDenmarkDjiboutiDominicaDominican RepublicEarly-demographic dividendEast Asia & PacificEast Asia & Pacific (excluding high income)East Asia & Pacific (IDA & IBRD countries)EcuadorEgypt, Arab Rep.El SalvadorEquatorial GuineaEritreaEstoniaEthiopiaEuro areaEurope & Central AsiaEurope & Central Asia (excluding high income)Europe & Central Asia (IDA & IBRD countries)European UnionFaroe IslandsFijiFinlandFragile and conflict affected situationsFranceFrench PolynesiaGabonGambia, TheGeorgiaGermanyGhanaGreeceGrenadaGuatemalaGuineaGuinea-BissauGuyanaHaitiHeavily indebted poor countries (HIPC)High incomeHondurasHong Kong SAR, ChinaHungaryIBRD onlyIcelandIDA & IBRD totalIDA blendIDA onlyIDA totalIndiaIndonesiaIran, Islamic Rep.IraqIrelandIsraelItalyJamaicaJapanJordanKazakhstanKenyaKiribatiKorea, Rep.KosovoKuwaitKyrgyz RepublicLao PDRLate-demographic dividendLatin America & Caribbean Latin America & Caribbean (excluding high income)Latin America & the Caribbean (IDA & IBRD countries)LatviaLeast developed countries: UN classificationLebanonLesothoLiberiaLibyaLithuaniaLow & middle incomeLow incomeLower middle incomeLuxembourgMacao SAR, ChinaMacedonia, FYRMadagascarMalawiMalaysiaMaldivesMaliMaltaMauritaniaMauritiusMexicoMicronesia, Fed. Sts.Middle East & North AfricaMiddle East & North Africa (excluding high income)Middle East & North Africa (IDA & IBRD countries)Middle incomeMoldovaMongoliaMontenegroMoroccoMozambiqueNamibiaNepalNetherlandsNew CaledoniaNew ZealandNicaraguaNigerNigeriaNorth AmericaNorwayOECD membersOmanOther small statesPakistanPanamaPapua New GuineaParaguayPeruPhilippinesPolandPortugalPost-demographic dividendPre-demographic dividendPuerto RicoQatarRomaniaRussian FederationRwandaSaudi ArabiaSenegalSerbiaSeychellesSierra LeoneSingaporeSlovak RepublicSloveniaSmall statesSolomon IslandsSomaliaSouth AfricaSouth AsiaSouth Asia (IDA & IBRD)South SudanSpainSri LankaSt. Kitts and NevisSt. LuciaSt. Vincent and the GrenadinesSub-Saharan Africa Sub-Saharan Africa (excluding high income)Sub-Saharan Africa (IDA & IBRD countries)SudanSurinameSwazilandSwedenSwitzerlandSyrian Arab RepublicTajikistanTanzaniaThailandTimor-LesteTogoTongaTrinidad and TobagoTunisiaTurkeyTurkmenistanUgandaUkraineUnited Arab EmiratesUnited KingdomUnited StatesUpper middle incomeUruguayUzbekistanVanuatuVenezuela, RBVietnamWest Bank and GazaWorldYemen, Rep.ZambiaZimbabwe línea de tiempo (timeline):
En esta escala de tiempo se presenta un gráfico de 1961 y 2016 de Spain. Los datos de 1960 están ausentes. El número de observaciones reales por fecha: 56.
Fuente (nombre):
Indicadores del desarrollo mundial
Fuente (organización):
World Bank national accounts data, and OECD National Accounts data files.
Categorías:
Economy & Growth
Se ha actualizado:
23 abr 2017 año
Los indicadores de los cambios de valor en los últimos años
Mínimo:
1.086 bn
1 ene 1961 año
Máximo:
307.069 bn
1 ene 2010 año
A la fecha de observación
Valor
Cambio absoluto
El cambio con respecto al valor anterior
1 ene 1961 año
1.086 bn
+1.086 bn
0.0%
1 ene 1962 año
1.218 bn
+132.379 millones
12.2%
1 ene 1963 año
1.399 bn
+181.549 millones
14.91%
1 ene 1964 año
1.715 bn
+315.819 millones
22.57%
1 ene 1965 año
1.872 bn
+156.964 millones
9.15%
1 ene 1966 año
2.23 bn
+357.423 millones
19.09%
1 ene 1967 año
2.683 bn
+453.856 millones
20.36%
1 ene 1968 año
3.196 bn
+512.605 millones
19.1%
1 ene 1969 año
3.072 bn
-124.38 millones
-3.89%
1 ene 1970 año
3.529 bn
+457.11 millones
14.88%
1 ene 1971 año
4.044 bn
+514.978 millones
14.59%
1 ene 1972 año
4.679 bn
+635.337 millones
15.71%
1 ene 1973 año
5.866 bn
+1.187 bn
25.36%
1 ene 1974 año
7.791 bn
+1.925 bn
32.81%
1 ene 1975 año
10.033 bn
+2.242 bn
28.78%
1 ene 1976 año
12.502 bn
+2.469 bn
24.61%
1 ene 1977 año
13.944 bn
+1.442 bn
11.53%
1 ene 1978 año
15.868 bn
+1.924 bn
13.8%
1 ene 1979 año
19.949 bn
+4.081 bn
25.72%
1 ene 1980 año
27.78 bn
+7.83 bn
39.25%
1 ene 1981 año
31.651 bn
+3.872 bn
13.94%
1 ene 1982 año
29.475 bn
-2.177 bn
-6.88%
1 ene 1983 año
28.827 bn
-647.739 millones
-2.2%
1 ene 1984 año
25.893 bn
-2.933 bn
-10.18%
1 ene 1985 año
25.659 bn
-234.198 millones
-0.9%
1 ene 1986 año
27.44 bn
+1.781 bn
6.94%
1 ene 1987 año
37.655 bn
+10.214 bn
37.22%
1 ene 1988 año
49.338 bn
+11.684 bn
31.03%
1 ene 1989 año
57.653 bn
+8.315 bn
16.85%
1 ene 1990 año
65.642 bn
+7.988 bn
13.86%
1 ene 1991 año
87.137 bn
+21.496 bn
32.75%
1 ene 1992 año
97.609 bn
+10.472 bn
12.02%
1 ene 1993 año
112.278 bn
+14.669 bn
15.03%
1 ene 1994 año
96.274 bn
-16.004 bn
-14.25%
1 ene 1995 año
94.187 bn
-2.087 bn
-2.17%
1 ene 1996 año
108.197 bn
+14.01 bn
14.88%
1 ene 1997 año
112.451 bn
+4.254 bn
3.93%
1 ene 1998 año
100.518 bn
-11.933 bn
-10.61%
1 ene 1999 año
104.458 bn
+3.94 bn
3.92%
1 ene 2000 año
106.627 bn
+2.169 bn
2.08%
1 ene 2001 año
99.607 bn
-7.02 bn
-6.58%
1 ene 2002 año
103.715 bn
+4.108 bn
4.12%
1 ene 2003 año
117.223 bn
+13.508 bn
13.02%
1 ene 2004 año
152.018 bn
+34.795 bn
29.68%
1 ene 2005 año
183.532 bn
+31.514 bn
20.73%
1 ene 2006 año
200.336 bn
+16.803 bn
9.16%
1 ene 2007 año
219.457 bn
+19.121 bn
9.54%
1 ene 2008 año
261.486 bn
+42.03 bn
19.15%
1 ene 2009 año
306.901 bn
+45.414 bn
17.37%
1 ene 2010 año
307.069 bn
+168.088 millones
0.05%
1 ene 2011 año
293.662 bn
-13.406 bn
-4.37%
1 ene 2012 año
305.356 bn
+11.694 bn
3.98%
1 ene 2013 año
263.7 bn
-41.656 bn
-13.64%
1 ene 2014 año
268.699 bn
+4.999 bn
1.9%
1 ene 2015 año
268.58 bn
-118.844 millones
-0.04%
1 ene 2016 año
231.418 bn
-37.162 bn
-13.84%
Ranking de los países por los datos estadísticos actuales


Comentarios: