29
/es/
es
AIzaSyAYiBZKx7MnpbEhh9jyipgxe19OcubqV5w
April 1, 2024
133158
Finland
FIN
true
2
1
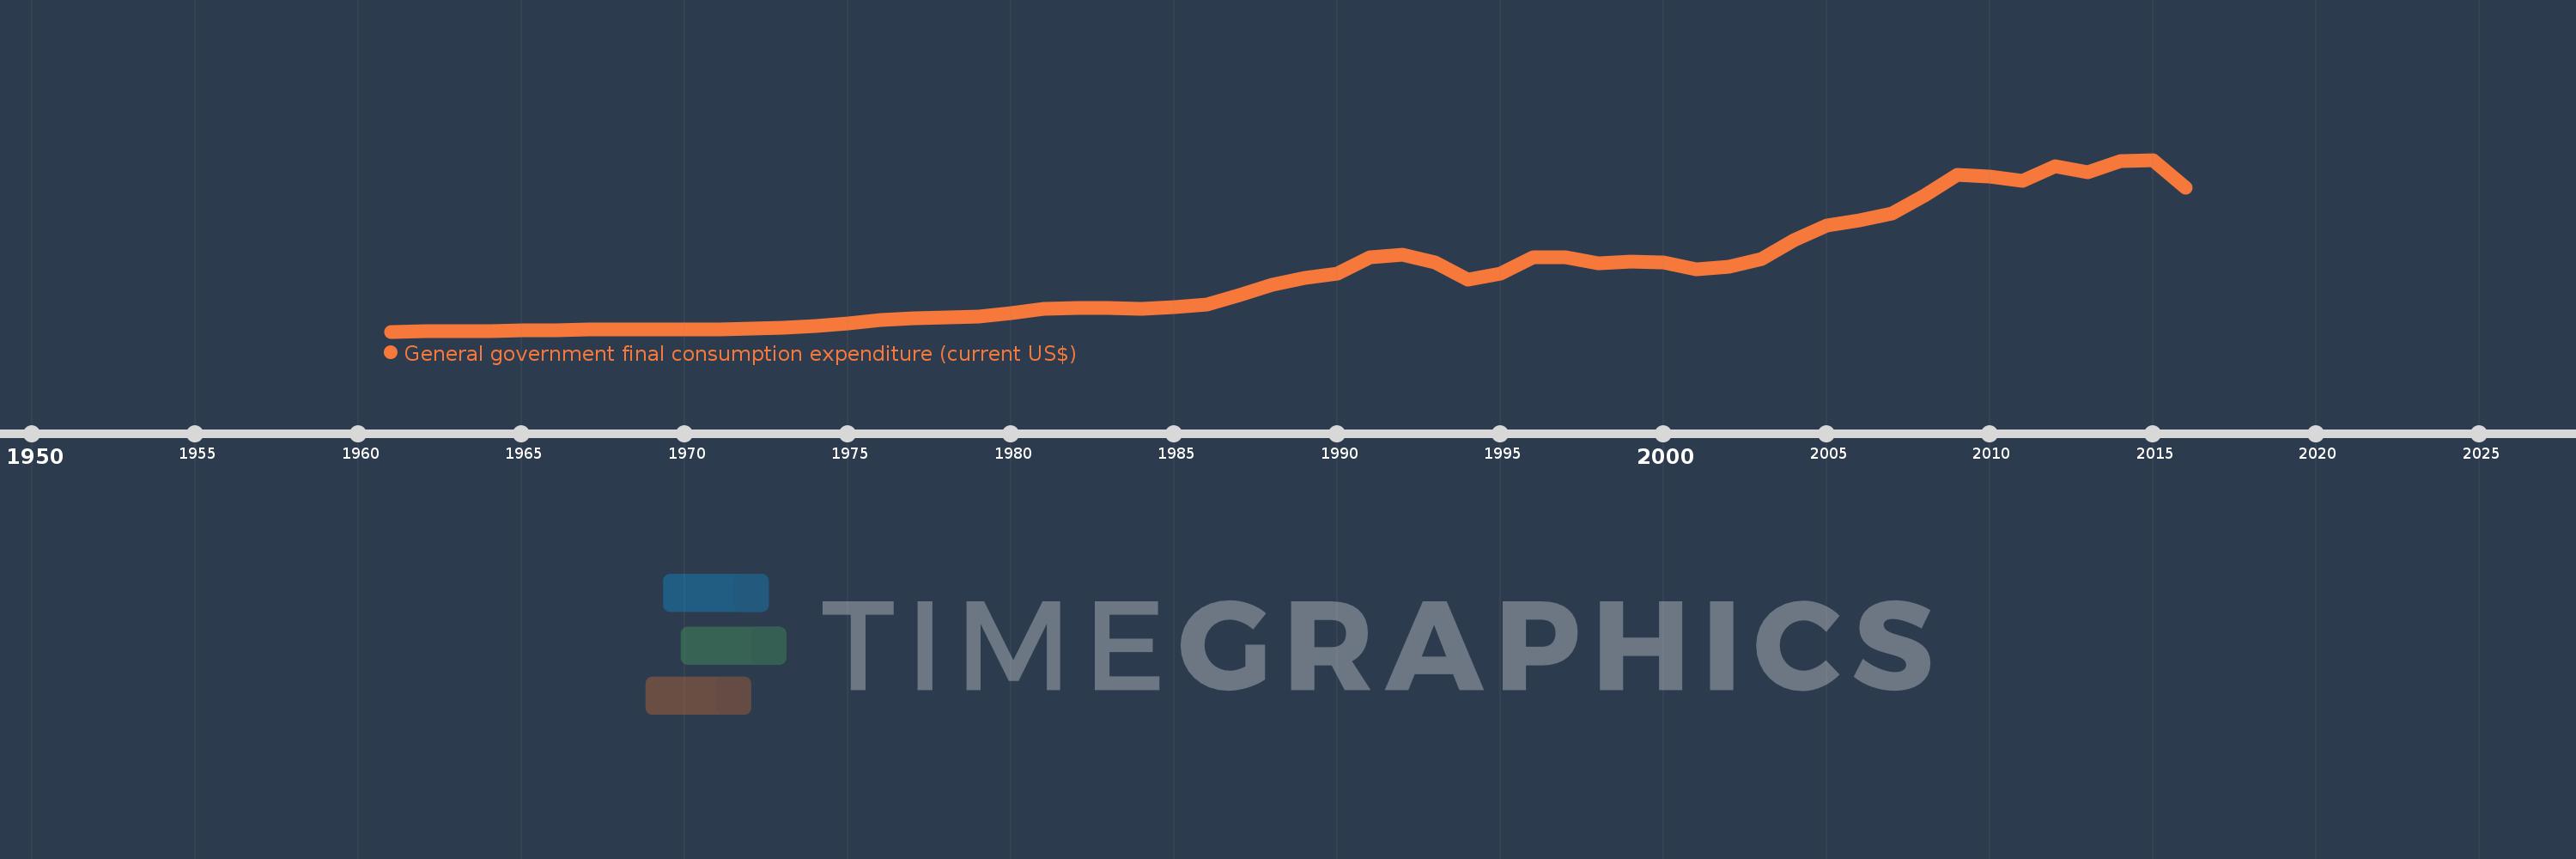
General government final consumption expenditure (current US$)
2016,2015,2014,2013,2012,2011,2010,2009,2008,2007,2006,2005,2004,2003,2002,2001,2000,1999,1998,1997,1996,1995,1994,1993,1992,1991,1990,1989,1988,1987,1986,1985,1984,1983,1982,1981,1980,1979,1978,1977,1976,1975,1974,1973,1972,1971,1970,1969,1968,1967,1966,1965,1964,1963,1962,1961
Estas estadísticas en otros países:
AfghanistanAlbaniaAlgeriaAngolaAntigua and BarbudaArab WorldArgentinaArmeniaArubaAustraliaAustriaAzerbaijanBahamas, TheBahrainBangladeshBarbadosBelarusBelgiumBelizeBeninBermudaBhutanBoliviaBosnia and HerzegovinaBotswanaBrazilBrunei DarussalamBulgariaBurkina FasoBurundiCabo VerdeCambodiaCameroonCanadaCaribbean small statesCentral African RepublicCentral Europe and the BalticsChadChileChinaColombiaComorosCongo, Dem. Rep.Congo, Rep.Costa RicaCote d'IvoireCroatiaCubaCyprusCzech RepublicDenmarkDjiboutiDominicaDominican RepublicEarly-demographic dividendEast Asia & PacificEast Asia & Pacific (excluding high income)East Asia & Pacific (IDA & IBRD countries)EcuadorEgypt, Arab Rep.El SalvadorEquatorial GuineaEritreaEstoniaEthiopiaEuro areaEurope & Central AsiaEurope & Central Asia (excluding high income)Europe & Central Asia (IDA & IBRD countries)European UnionFaroe IslandsFijiFinlandFragile and conflict affected situationsFranceFrench PolynesiaGabonGambia, TheGeorgiaGermanyGhanaGreeceGrenadaGuatemalaGuineaGuinea-BissauGuyanaHaitiHeavily indebted poor countries (HIPC)High incomeHondurasHong Kong SAR, ChinaHungaryIBRD onlyIcelandIDA & IBRD totalIDA blendIDA onlyIDA totalIndiaIndonesiaIran, Islamic Rep.IraqIrelandIsraelItalyJamaicaJapanJordanKazakhstanKenyaKiribatiKorea, Rep.KosovoKuwaitKyrgyz RepublicLao PDRLate-demographic dividendLatin America & Caribbean Latin America & Caribbean (excluding high income)Latin America & the Caribbean (IDA & IBRD countries)LatviaLeast developed countries: UN classificationLebanonLesothoLiberiaLibyaLithuaniaLow & middle incomeLow incomeLower middle incomeLuxembourgMacao SAR, ChinaMacedonia, FYRMadagascarMalawiMalaysiaMaldivesMaliMaltaMauritaniaMauritiusMexicoMicronesia, Fed. Sts.Middle East & North AfricaMiddle East & North Africa (excluding high income)Middle East & North Africa (IDA & IBRD countries)Middle incomeMoldovaMongoliaMontenegroMoroccoMozambiqueNamibiaNepalNetherlandsNew CaledoniaNew ZealandNicaraguaNigerNigeriaNorth AmericaNorwayOECD membersOmanOther small statesPakistanPanamaPapua New GuineaParaguayPeruPhilippinesPolandPortugalPost-demographic dividendPre-demographic dividendPuerto RicoQatarRomaniaRussian FederationRwandaSaudi ArabiaSenegalSerbiaSeychellesSierra LeoneSingaporeSlovak RepublicSloveniaSmall statesSolomon IslandsSomaliaSouth AfricaSouth AsiaSouth Asia (IDA & IBRD)South SudanSpainSri LankaSt. Kitts and NevisSt. LuciaSt. Vincent and the GrenadinesSub-Saharan Africa Sub-Saharan Africa (excluding high income)Sub-Saharan Africa (IDA & IBRD countries)SudanSurinameSwazilandSwedenSwitzerlandSyrian Arab RepublicTajikistanTanzaniaThailandTimor-LesteTogoTongaTrinidad and TobagoTunisiaTurkeyTurkmenistanUgandaUkraineUnited Arab EmiratesUnited KingdomUnited StatesUpper middle incomeUruguayUzbekistanVanuatuVenezuela, RBVietnamWest Bank and GazaWorldYemen, Rep.ZambiaZimbabwe línea de tiempo (timeline):
En esta escala de tiempo se presenta un gráfico de 1961 y 2016 de Finland. Los datos de 1960 están ausentes. El número de observaciones reales por fecha: 56.
Fuente (nombre):
Indicadores del desarrollo mundial
Fuente (organización):
World Bank national accounts data, and OECD National Accounts data files.
Categorías:
Economy & Growth
Se ha actualizado:
23 abr 2017 año
Los indicadores de los cambios de valor en los últimos años
Mínimo:
636.736 millones
1 ene 1961 año
Máximo:
67.28 bn
1 ene 2015 año
A la fecha de observación
Valor
Cambio absoluto
El cambio con respecto al valor anterior
1 ene 1961 año
636.736 millones
+636.736 millones
0.0%
1 ene 1962 año
710.928 millones
+74.192 millones
11.65%
1 ene 1963 año
812.159 millones
+101.231 millones
14.24%
1 ene 1964 año
943.727 millones
+131.568 millones
16.2%
1 ene 1965 año
1.071 bn
+127.611 millones
13.52%
1 ene 1966 año
1.199 bn
+127.941 millones
11.94%
1 ene 1967 año
1.348 bn
+148.385 millones
12.37%
1 ene 1968 año
1.425 bn
+76.987 millones
5.71%
1 ene 1969 año
1.377 bn
-47.377 millones
-3.33%
1 ene 1970 año
1.491 bn
+113.557 millones
8.25%
1 ene 1971 año
1.625 bn
+134.305 millones
9.01%
1 ene 1972 año
1.879 bn
+254.064 millones
15.63%
1 ene 1973 año
2.23 bn
+351.027 millones
18.68%
1 ene 1974 año
2.889 bn
+658.365 millones
29.52%
1 ene 1975 año
3.743 bn
+854.893 millones
29.6%
1 ene 1976 año
4.994 bn
+1.251 bn
33.42%
1 ene 1977 año
5.71 bn
+715.075 millones
14.32%
1 ene 1978 año
6.167 bn
+457.954 millones
8.02%
1 ene 1979 año
6.561 bn
+393.153 millones
6.37%
1 ene 1980 año
7.839 bn
+1.279 bn
19.49%
1 ene 1981 año
9.517 bn
+1.678 bn
21.4%
1 ene 1982 año
9.639 bn
+121.965 millones
1.28%
1 ene 1983 año
9.762 bn
+122.915 millones
1.28%
1 ene 1984 año
9.6 bn
-162.233 millones
-1.66%
1 ene 1985 año
10.041 bn
+440.861 millones
4.59%
1 ene 1986 año
11.03 bn
+989.753 millones
9.86%
1 ene 1987 año
14.682 bn
+3.652 bn
33.11%
1 ene 1988 año
18.643 bn
+3.961 bn
26.98%
1 ene 1989 año
21.43 bn
+2.787 bn
14.95%
1 ene 1990 año
23.159 bn
+1.729 bn
8.07%
1 ene 1991 año
29.583 bn
+6.424 bn
27.74%
1 ene 1992 año
30.618 bn
+1.034 bn
3.5%
1 ene 1993 año
27.361 bn
-3.256 bn
-10.64%
1 ene 1994 año
20.828 bn
-6.534 bn
-23.88%
1 ene 1995 año
23.179 bn
+2.352 bn
11.29%
1 ene 1996 año
29.439 bn
+6.26 bn
27.01%
1 ene 1997 año
29.337 bn
-101.695 millones
-0.35%
1 ene 1998 año
27.099 bn
-2.238 bn
-7.63%
1 ene 1999 año
27.632 bn
+533.556 millones
1.97%
1 ene 2000 año
27.452 bn
-180.875 millones
-0.65%
1 ene 2001 año
24.864 bn
-2.588 bn
-9.43%
1 ene 2002 año
25.843 bn
+979.756 millones
3.94%
1 ene 2003 año
28.884 bn
+3.04 bn
11.76%
1 ene 2004 año
36.209 bn
+7.325 bn
25.36%
1 ene 2005 año
41.848 bn
+5.639 bn
15.57%
1 ene 2006 año
43.95 bn
+2.102 bn
5.02%
1 ene 2007 año
46.348 bn
+2.398 bn
5.46%
1 ene 2008 año
53.292 bn
+6.944 bn
14.98%
1 ene 2009 año
61.501 bn
+8.21 bn
15.4%
1 ene 2010 año
60.906 bn
-595.584 millones
-0.97%
1 ene 2011 año
59.205 bn
-1.701 bn
-2.79%
1 ene 2012 año
64.625 bn
+5.419 bn
9.15%
1 ene 2013 año
62.55 bn
-2.075 bn
-3.21%
1 ene 2014 año
66.8 bn
+4.25 bn
6.8%
1 ene 2015 año
67.28 bn
+480.039 millones
0.72%
1 ene 2016 año
56.584 bn
-10.696 bn
-15.9%
Ranking de los países por los datos estadísticos actuales


Comentarios: