29
/es/
es
AIzaSyAYiBZKx7MnpbEhh9jyipgxe19OcubqV5w
April 1, 2024
229768
Russian Federation
RUS
true
2
1
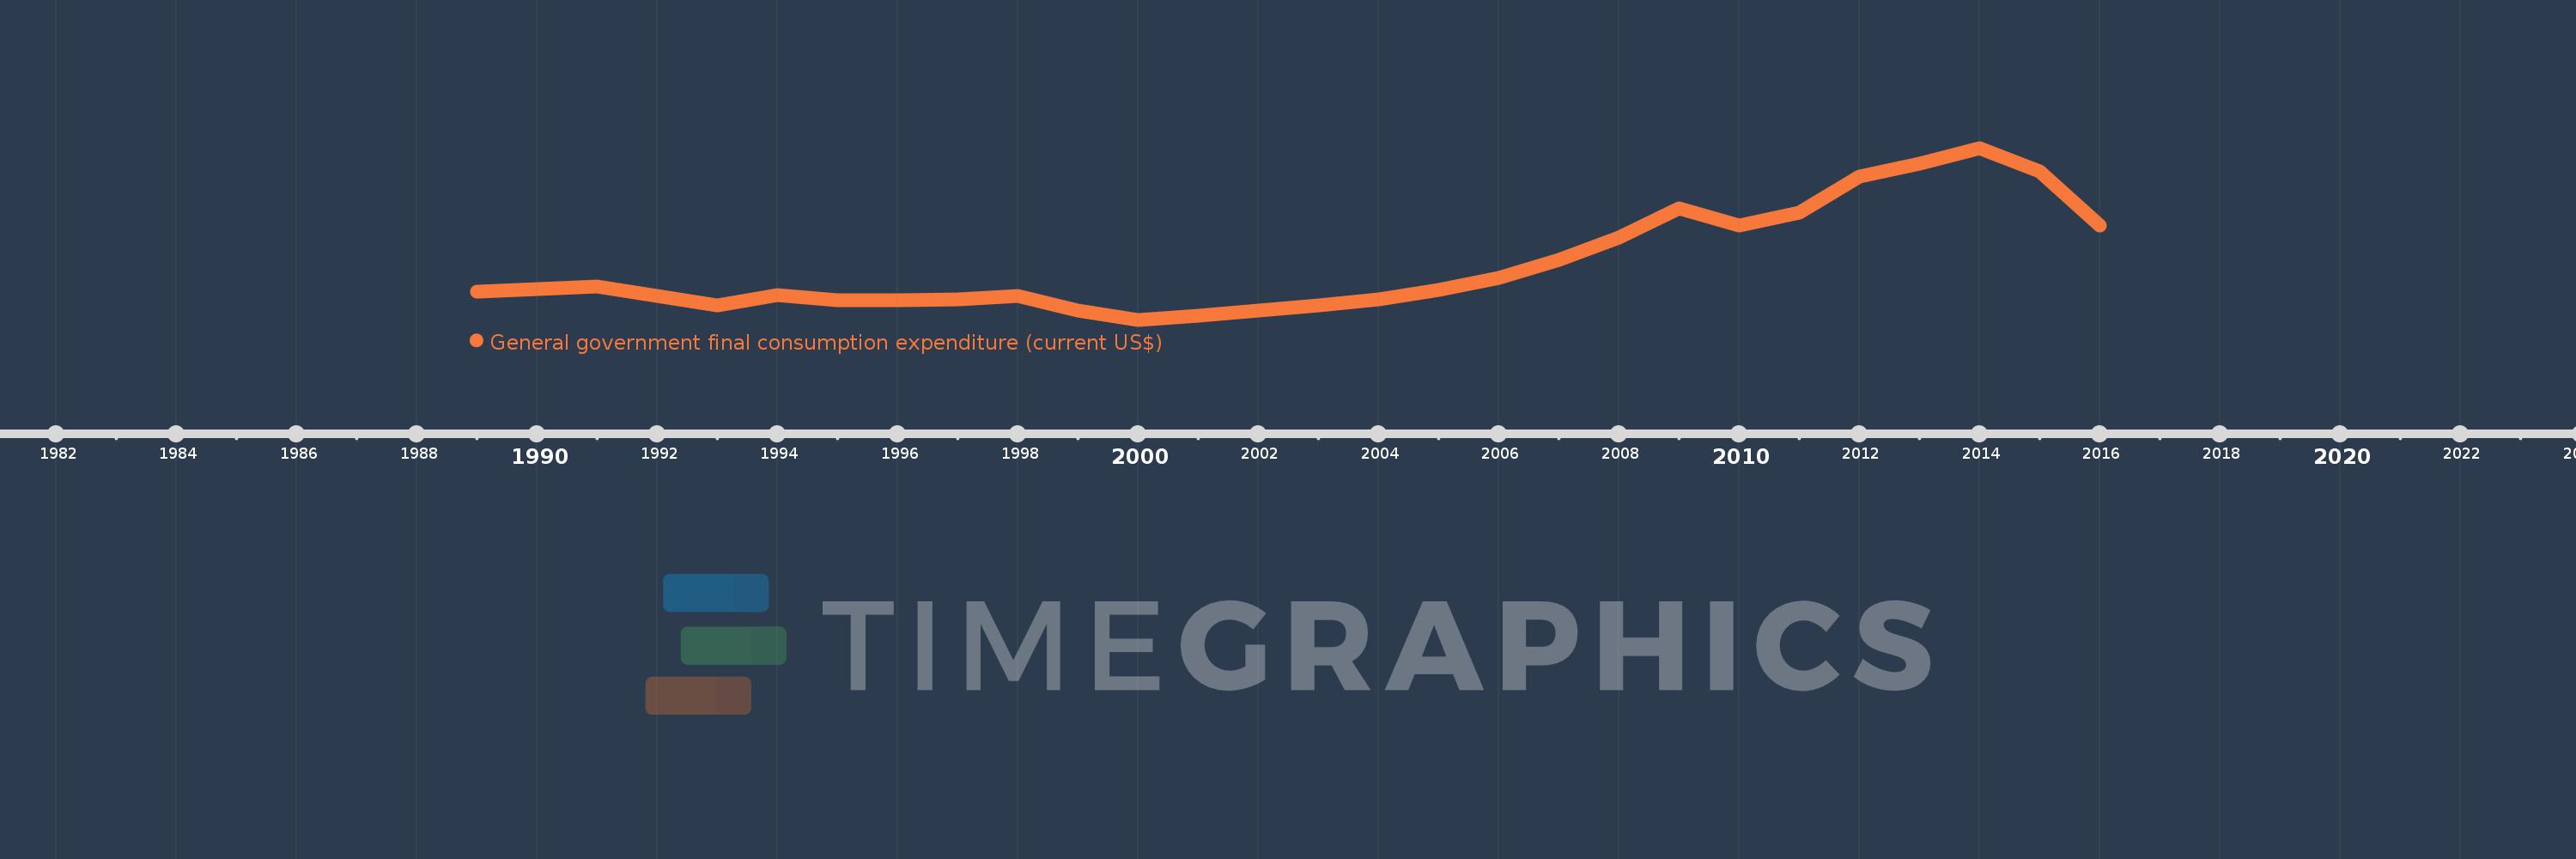
General government final consumption expenditure (current US$)
2016,2015,2014,2013,2012,2011,2010,2009,2008,2007,2006,2005,2004,2003,2002,2001,2000,1999,1998,1997,1996,1995,1994,1993,1992,1991,1990,1989
Estas estadísticas en otros países:
AfghanistanAlbaniaAlgeriaAngolaAntigua and BarbudaArab WorldArgentinaArmeniaArubaAustraliaAustriaAzerbaijanBahamas, TheBahrainBangladeshBarbadosBelarusBelgiumBelizeBeninBermudaBhutanBoliviaBosnia and HerzegovinaBotswanaBrazilBrunei DarussalamBulgariaBurkina FasoBurundiCabo VerdeCambodiaCameroonCanadaCaribbean small statesCentral African RepublicCentral Europe and the BalticsChadChileChinaColombiaComorosCongo, Dem. Rep.Congo, Rep.Costa RicaCote d'IvoireCroatiaCubaCyprusCzech RepublicDenmarkDjiboutiDominicaDominican RepublicEarly-demographic dividendEast Asia & PacificEast Asia & Pacific (excluding high income)East Asia & Pacific (IDA & IBRD countries)EcuadorEgypt, Arab Rep.El SalvadorEquatorial GuineaEritreaEstoniaEthiopiaEuro areaEurope & Central AsiaEurope & Central Asia (excluding high income)Europe & Central Asia (IDA & IBRD countries)European UnionFaroe IslandsFijiFinlandFragile and conflict affected situationsFranceFrench PolynesiaGabonGambia, TheGeorgiaGermanyGhanaGreeceGrenadaGuatemalaGuineaGuinea-BissauGuyanaHaitiHeavily indebted poor countries (HIPC)High incomeHondurasHong Kong SAR, ChinaHungaryIBRD onlyIcelandIDA & IBRD totalIDA blendIDA onlyIDA totalIndiaIndonesiaIran, Islamic Rep.IraqIrelandIsraelItalyJamaicaJapanJordanKazakhstanKenyaKiribatiKorea, Rep.KosovoKuwaitKyrgyz RepublicLao PDRLate-demographic dividendLatin America & Caribbean Latin America & Caribbean (excluding high income)Latin America & the Caribbean (IDA & IBRD countries)LatviaLeast developed countries: UN classificationLebanonLesothoLiberiaLibyaLithuaniaLow & middle incomeLow incomeLower middle incomeLuxembourgMacao SAR, ChinaMacedonia, FYRMadagascarMalawiMalaysiaMaldivesMaliMaltaMauritaniaMauritiusMexicoMicronesia, Fed. Sts.Middle East & North AfricaMiddle East & North Africa (excluding high income)Middle East & North Africa (IDA & IBRD countries)Middle incomeMoldovaMongoliaMontenegroMoroccoMozambiqueNamibiaNepalNetherlandsNew CaledoniaNew ZealandNicaraguaNigerNigeriaNorth AmericaNorwayOECD membersOmanOther small statesPakistanPanamaPapua New GuineaParaguayPeruPhilippinesPolandPortugalPost-demographic dividendPre-demographic dividendPuerto RicoQatarRomaniaRussian FederationRwandaSaudi ArabiaSenegalSerbiaSeychellesSierra LeoneSingaporeSlovak RepublicSloveniaSmall statesSolomon IslandsSomaliaSouth AfricaSouth AsiaSouth Asia (IDA & IBRD)South SudanSpainSri LankaSt. Kitts and NevisSt. LuciaSt. Vincent and the GrenadinesSub-Saharan Africa Sub-Saharan Africa (excluding high income)Sub-Saharan Africa (IDA & IBRD countries)SudanSurinameSwazilandSwedenSwitzerlandSyrian Arab RepublicTajikistanTanzaniaThailandTimor-LesteTogoTongaTrinidad and TobagoTunisiaTurkeyTurkmenistanUgandaUkraineUnited Arab EmiratesUnited KingdomUnited StatesUpper middle incomeUruguayUzbekistanVanuatuVenezuela, RBVietnamWest Bank and GazaWorldYemen, Rep.ZambiaZimbabwe línea de tiempo (timeline):
En esta escala de tiempo se presenta un gráfico de 1989 y 2016 de Russian Federation. Los datos de 1988 están ausentes. El número de observaciones reales por fecha: 28.
Fuente (nombre):
Indicadores del desarrollo mundial
Fuente (organización):
World Bank national accounts data, and OECD National Accounts data files.
Categorías:
Economy & Growth
Se ha actualizado:
23 abr 2017 año
Los indicadores de los cambios de valor en los últimos años
Mínimo:
28.562 bn
1 ene 2000 año
Máximo:
439.918 bn
1 ene 2014 año
A la fecha de observación
Valor
Cambio absoluto
El cambio con respecto al valor anterior
1 ene 1989 año
95.203 bn
+95.203 bn
0.0%
1 ene 1990 año
101.919 bn
+6.715 bn
7.05%
1 ene 1991 año
107.422 bn
+5.503 bn
5.4%
1 ene 1992 año
85.519 bn
-21.904 bn
-20.39%
1 ene 1993 año
63.785 bn
-21.734 bn
-25.41%
1 ene 1994 año
87.187 bn
+23.403 bn
36.69%
1 ene 1995 año
75.458 bn
-11.73 bn
-13.45%
1 ene 1996 año
75.451 bn
-6.339 millones
-0.01%
1 ene 1997 año
76.362 bn
+910.468 millones
1.21%
1 ene 1998 año
85.307 bn
+8.945 bn
11.71%
1 ene 1999 año
50.757 bn
-34.549 bn
-40.5%
1 ene 2000 año
28.562 bn
-22.195 bn
-43.73%
1 ene 2001 año
39.193 bn
+10.631 bn
37.22%
1 ene 2002 año
50.391 bn
+11.198 bn
28.57%
1 ene 2003 año
61.96 bn
+11.569 bn
22.96%
1 ene 2004 año
77.102 bn
+15.142 bn
24.44%
1 ene 2005 año
100.305 bn
+23.204 bn
30.1%
1 ene 2006 año
128.901 bn
+28.596 bn
28.51%
1 ene 2007 año
172.13 bn
+43.229 bn
33.54%
1 ene 2008 año
224.817 bn
+52.687 bn
30.61%
1 ene 2009 año
296.138 bn
+71.321 bn
31.72%
1 ene 2010 año
254.146 bn
-41.992 bn
-14.18%
1 ene 2011 año
285.542 bn
+31.396 bn
12.35%
1 ene 2012 año
370.45 bn
+84.908 bn
29.74%
1 ene 2013 año
402.427 bn
+31.977 bn
8.63%
1 ene 2014 año
439.918 bn
+37.492 bn
9.32%
1 ene 2015 año
384.23 bn
-55.689 bn
-12.66%
1 ene 2016 año
253.763 bn
-130.467 bn
-33.96%
Ranking de los países por los datos estadísticos actuales


Comentarios: