29
/es/
es
AIzaSyAYiBZKx7MnpbEhh9jyipgxe19OcubqV5w
April 1, 2024
62338
World
WLD
false
2
1
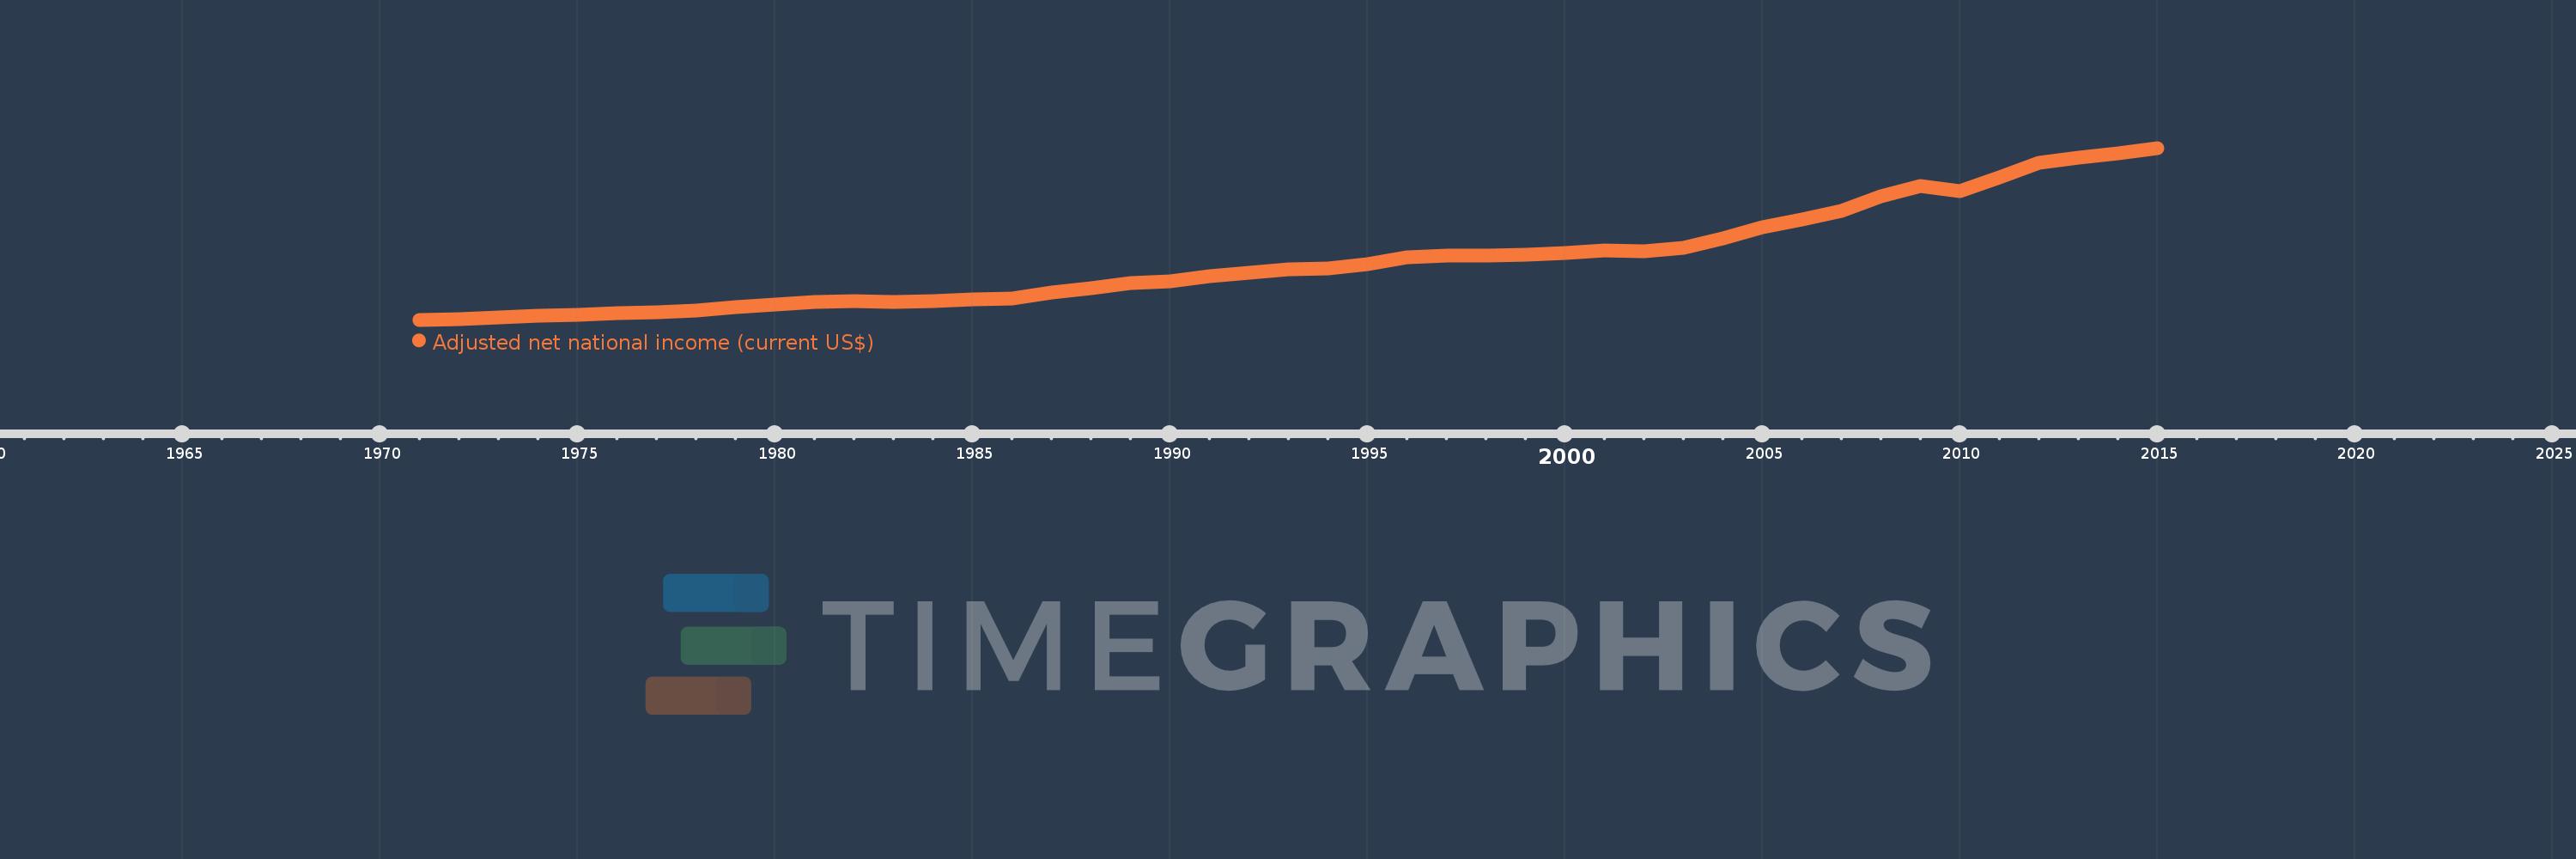
Adjusted net national income (current US$)
2015,2014,2013,2012,2011,2010,2009,2008,2007,2006,2005,2004,2003,2002,2001,2000,1999,1998,1997,1996,1995,1994,1993,1992,1991,1990,1989,1988,1987,1986,1985,1984,1983,1982,1981,1980,1979,1978,1977,1976,1975,1974,1973,1972,1971
Estas estadísticas en otros países:
AfghanistanAlbaniaAlgeriaAngolaArab WorldArgentinaArmeniaAustraliaAustriaAzerbaijanBahamas, TheBahrainBangladeshBarbadosBelarusBelgiumBelizeBeninBhutanBoliviaBotswanaBrazilBrunei DarussalamBulgariaBurkina FasoBurundiCabo VerdeCambodiaCameroonCanadaCaribbean small statesCentral African RepublicCentral Europe and the BalticsChadChileChinaColombiaComorosCongo, Dem. Rep.Congo, Rep.Costa RicaCote d'IvoireCroatiaCubaCyprusCzech RepublicDenmarkDjiboutiDominicaDominican RepublicEarly-demographic dividendEast Asia & PacificEast Asia & Pacific (excluding high income)East Asia & Pacific (IDA & IBRD countries)EcuadorEgypt, Arab Rep.El SalvadorEquatorial GuineaEritreaEstoniaEthiopiaEuro areaEurope & Central AsiaEurope & Central Asia (excluding high income)Europe & Central Asia (IDA & IBRD countries)European UnionFijiFinlandFragile and conflict affected situationsFranceGabonGambia, TheGeorgiaGermanyGhanaGreeceGuatemalaGuineaGuinea-BissauGuyanaHaitiHeavily indebted poor countries (HIPC)High incomeHondurasHong Kong SAR, ChinaHungaryIBRD onlyIcelandIDA & IBRD totalIDA blendIDA onlyIDA totalIndiaIndonesiaIran, Islamic Rep.IraqIrelandIsraelItalyJamaicaJapanJordanKazakhstanKenyaKiribatiKorea, Rep.KuwaitKyrgyz RepublicLao PDRLate-demographic dividendLatin America & Caribbean Latin America & Caribbean (excluding high income)Latin America & the Caribbean (IDA & IBRD countries)LatviaLeast developed countries: UN classificationLebanonLesothoLiberiaLibyaLithuaniaLow & middle incomeLow incomeLower middle incomeLuxembourgMacedonia, FYRMadagascarMalawiMalaysiaMaldivesMaliMauritaniaMauritiusMexicoMiddle East & North AfricaMiddle East & North Africa (excluding high income)Middle East & North Africa (IDA & IBRD countries)Middle incomeMoldovaMongoliaMoroccoMozambiqueMyanmarNamibiaNepalNetherlandsNew ZealandNicaraguaNigerNigeriaNorth AmericaNorwayOECD membersOmanOther small statesPacific island small statesPakistanPanamaPapua New GuineaParaguayPeruPhilippinesPolandPortugalPost-demographic dividendPre-demographic dividendQatarRomaniaRussian FederationRwandaSamoaSao Tome and PrincipeSaudi ArabiaSenegalSeychellesSierra LeoneSingaporeSlovak RepublicSloveniaSmall statesSolomon IslandsSouth AfricaSouth AsiaSouth Asia (IDA & IBRD)SpainSri LankaSt. LuciaSt. Vincent and the GrenadinesSub-Saharan Africa Sub-Saharan Africa (excluding high income)Sub-Saharan Africa (IDA & IBRD countries)SudanSurinameSwazilandSwedenSwitzerlandSyrian Arab RepublicTajikistanTanzaniaThailandTogoTongaTrinidad and TobagoTunisiaTurkeyTurkmenistanUgandaUkraineUnited Arab EmiratesUnited KingdomUnited StatesUpper middle incomeUruguayUzbekistanVanuatuVenezuela, RBVietnamWorldYemen, Rep.ZambiaZimbabwe línea de tiempo (timeline):
En esta escala de tiempo se presenta un gráfico de 1971 y 2015 de World. Los datos de 1970 están ausentes. El número de observaciones reales por fecha: 45.
Fuente (nombre):
Indicadores del desarrollo mundial
Fuente (organización):
World Bank staff estimates based on sources and methods in World Bank's "The Changing Wealth of Nations: Measuring Sustainable Development in the New Millennium" (2011).
Categorías:
Economy & Growth
Se ha actualizado:
23 abr 2017 año
Los indicadores de los cambios de valor en los últimos años
En promedio:
24.063 billones
Mínimo:
2.559 billones
1 ene 1971 año
Máximo:
65.076 billones
1 ene 2015 año
A la fecha de observación
Valor
Cambio absoluto
El cambio con respecto al valor anterior
1 ene 1971 año
2.559 billones
+2.559 billones
0.0%
1 ene 1972 año
2.818 billones
+258.975 bn
10.12%
1 ene 1973 año
3.252 billones
+434.526 bn
15.42%
1 ene 1974 año
3.952 billones
+699.456 bn
21.51%
1 ene 1975 año
4.439 billones
+487.624 bn
12.34%
1 ene 1976 año
4.944 billones
+504.75 bn
11.37%
1 ene 1977 año
5.363 billones
+418.654 bn
8.47%
1 ene 1978 año
6.053 billones
+689.735 bn
12.86%
1 ene 1979 año
7.14 billones
+1.087 billones
17.96%
1 ene 1980 año
8.076 billones
+936.111 bn
13.11%
1 ene 1981 año
8.965 billones
+888.771 bn
11.01%
1 ene 1982 año
9.211 billones
+246.513 bn
2.75%
1 ene 1983 año
9.149 billones
-61.929 bn
-0.67%
1 ene 1984 año
9.405 billones
+255.488 bn
2.79%
1 ene 1985 año
9.819 billones
+414.712 bn
4.41%
1 ene 1986 año
10.349 billones
+529.306 bn
5.39%
1 ene 1987 año
12.358 billones
+2.009 billones
19.41%
1 ene 1988 año
14.037 billones
+1.679 billones
13.59%
1 ene 1989 año
15.837 billones
+1.8 billones
12.82%
1 ene 1990 año
16.547 billones
+709.985 bn
4.48%
1 ene 1991 año
18.492 billones
+1.946 billones
11.76%
1 ene 1992 año
19.593 billones
+1.1 billones
5.95%
1 ene 1993 año
20.891 billones
+1.298 billones
6.63%
1 ene 1994 año
21.212 billones
+320.977 bn
1.54%
1 ene 1995 año
22.852 billones
+1.641 billones
7.73%
1 ene 1996 año
25.363 billones
+2.511 billones
10.99%
1 ene 1997 año
25.984 billones
+620.107 bn
2.44%
1 ene 1998 año
26.022 billones
+38.684 bn
0.15%
1 ene 1999 año
26.104 billones
+81.757 bn
0.31%
1 ene 2000 año
26.999 billones
+894.617 bn
3.43%
1 ene 2001 año
27.703 billones
+704.205 bn
2.61%
1 ene 2002 año
27.608 billones
-94.736 bn
-0.34%
1 ene 2003 año
28.659 billones
+1.051 billones
3.81%
1 ene 2004 año
32.134 billones
+3.475 billones
12.13%
1 ene 2005 año
36.205 billones
+4.071 billones
12.67%
1 ene 2006 año
38.938 billones
+2.732 billones
7.55%
1 ene 2007 año
42.279 billones
+3.341 billones
8.58%
1 ene 2008 año
47.465 billones
+5.186 billones
12.27%
1 ene 2009 año
51.134 billones
+3.669 billones
7.73%
1 ene 2010 año
49.276 billones
-1.859 billones
-3.64%
1 ene 2011 año
54.205 billones
+4.93 billones
10.0%
1 ene 2012 año
59.748 billones
+5.542 billones
10.22%
1 ene 2013 año
61.484 billones
+1.736 billones
2.91%
1 ene 2014 año
63.157 billones
+1.672 billones
2.72%
1 ene 2015 año
65.076 billones
+1.92 billones
3.04%
Ranking de los países por los datos estadísticos actuales


Comentarios: