29
/es/
es
AIzaSyAYiBZKx7MnpbEhh9jyipgxe19OcubqV5w
April 1, 2024
163458
Japan
JPN
true
2
1
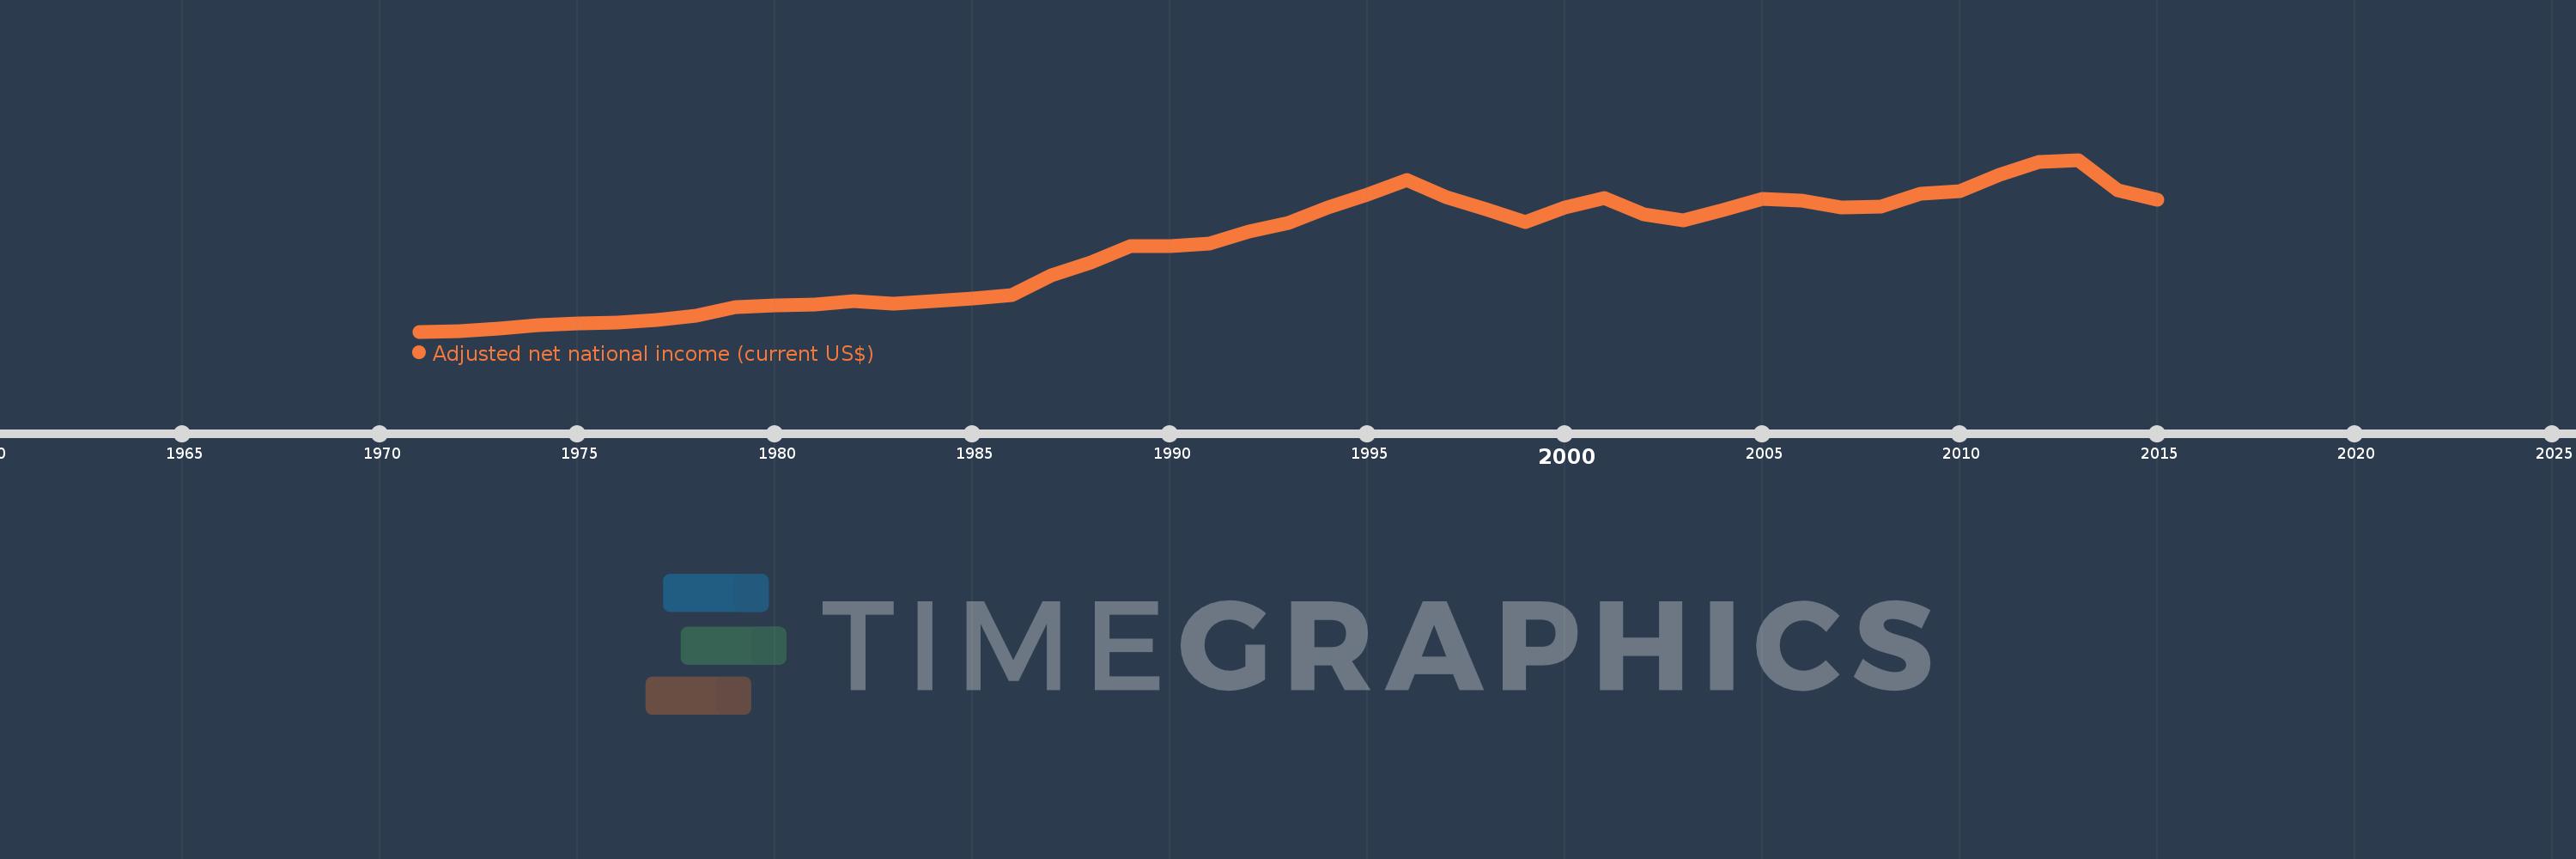
Adjusted net national income (current US$)
2015,2014,2013,2012,2011,2010,2009,2008,2007,2006,2005,2004,2003,2002,2001,2000,1999,1998,1997,1996,1995,1994,1993,1992,1991,1990,1989,1988,1987,1986,1985,1984,1983,1982,1981,1980,1979,1978,1977,1976,1975,1974,1973,1972,1971
Estas estadísticas en otros países:
AfghanistanAlbaniaAlgeriaAngolaArab WorldArgentinaArmeniaAustraliaAustriaAzerbaijanBahamas, TheBahrainBangladeshBarbadosBelarusBelgiumBelizeBeninBhutanBoliviaBotswanaBrazilBrunei DarussalamBulgariaBurkina FasoBurundiCabo VerdeCambodiaCameroonCanadaCaribbean small statesCentral African RepublicCentral Europe and the BalticsChadChileChinaColombiaComorosCongo, Dem. Rep.Congo, Rep.Costa RicaCote d'IvoireCroatiaCubaCyprusCzech RepublicDenmarkDjiboutiDominicaDominican RepublicEarly-demographic dividendEast Asia & PacificEast Asia & Pacific (excluding high income)East Asia & Pacific (IDA & IBRD countries)EcuadorEgypt, Arab Rep.El SalvadorEquatorial GuineaEritreaEstoniaEthiopiaEuro areaEurope & Central AsiaEurope & Central Asia (excluding high income)Europe & Central Asia (IDA & IBRD countries)European UnionFijiFinlandFragile and conflict affected situationsFranceGabonGambia, TheGeorgiaGermanyGhanaGreeceGuatemalaGuineaGuinea-BissauGuyanaHaitiHeavily indebted poor countries (HIPC)High incomeHondurasHong Kong SAR, ChinaHungaryIBRD onlyIcelandIDA & IBRD totalIDA blendIDA onlyIDA totalIndiaIndonesiaIran, Islamic Rep.IraqIrelandIsraelItalyJamaicaJapanJordanKazakhstanKenyaKiribatiKorea, Rep.KuwaitKyrgyz RepublicLao PDRLate-demographic dividendLatin America & Caribbean Latin America & Caribbean (excluding high income)Latin America & the Caribbean (IDA & IBRD countries)LatviaLeast developed countries: UN classificationLebanonLesothoLiberiaLibyaLithuaniaLow & middle incomeLow incomeLower middle incomeLuxembourgMacedonia, FYRMadagascarMalawiMalaysiaMaldivesMaliMauritaniaMauritiusMexicoMiddle East & North AfricaMiddle East & North Africa (excluding high income)Middle East & North Africa (IDA & IBRD countries)Middle incomeMoldovaMongoliaMoroccoMozambiqueMyanmarNamibiaNepalNetherlandsNew ZealandNicaraguaNigerNigeriaNorth AmericaNorwayOECD membersOmanOther small statesPacific island small statesPakistanPanamaPapua New GuineaParaguayPeruPhilippinesPolandPortugalPost-demographic dividendPre-demographic dividendQatarRomaniaRussian FederationRwandaSamoaSao Tome and PrincipeSaudi ArabiaSenegalSeychellesSierra LeoneSingaporeSlovak RepublicSloveniaSmall statesSolomon IslandsSouth AfricaSouth AsiaSouth Asia (IDA & IBRD)SpainSri LankaSt. LuciaSt. Vincent and the GrenadinesSub-Saharan Africa Sub-Saharan Africa (excluding high income)Sub-Saharan Africa (IDA & IBRD countries)SudanSurinameSwazilandSwedenSwitzerlandSyrian Arab RepublicTajikistanTanzaniaThailandTogoTongaTrinidad and TobagoTunisiaTurkeyTurkmenistanUgandaUkraineUnited Arab EmiratesUnited KingdomUnited StatesUpper middle incomeUruguayUzbekistanVanuatuVenezuela, RBVietnamWorldYemen, Rep.ZambiaZimbabwe línea de tiempo (timeline):
En esta escala de tiempo se presenta un gráfico de 1971 y 2015 de Japan. Los datos de 1970 están ausentes. El número de observaciones reales por fecha: 45.
Fuente (nombre):
Indicadores del desarrollo mundial
Fuente (organización):
World Bank staff estimates based on sources and methods in World Bank's "The Changing Wealth of Nations: Measuring Sustainable Development in the New Millennium" (2011).
Categorías:
Economy & Growth
Se ha actualizado:
23 abr 2017 año
Los indicadores de los cambios de valor en los últimos años
En promedio:
2.51 billones
Mínimo:
175.739 bn
1 ene 1971 año
Máximo:
4.881 billones
1 ene 2013 año
A la fecha de observación
Valor
Cambio absoluto
El cambio con respecto al valor anterior
1 ene 1971 año
175.739 bn
+175.739 bn
0.0%
1 ene 1972 año
198.009 bn
+22.27 bn
12.67%
1 ene 1973 año
261.367 bn
+63.359 bn
32.0%
1 ene 1974 año
356.506 bn
+95.139 bn
36.4%
1 ene 1975 año
396.7 bn
+40.194 bn
11.27%
1 ene 1976 año
434.332 bn
+37.632 bn
9.49%
1 ene 1977 año
490.939 bn
+56.606 bn
13.03%
1 ene 1978 año
604.84 bn
+113.901 bn
23.2%
1 ene 1979 año
852.786 bn
+247.947 bn
40.99%
1 ene 1980 año
885.441 bn
+32.654 bn
3.83%
1 ene 1981 año
921.971 bn
+36.53 bn
4.13%
1 ene 1982 año
1.01 billones
+88.347 bn
9.58%
1 ene 1983 año
938.933 bn
-71.385 bn
-7.07%
1 ene 1984 año
1.022 billones
+82.758 bn
8.81%
1 ene 1985 año
1.087 billones
+65.324 bn
6.39%
1 ene 1986 año
1.165 billones
+77.935 bn
7.17%
1 ene 1987 año
1.72 billones
+554.982 bn
47.64%
1 ene 1988 año
2.08 billones
+360.183 bn
20.94%
1 ene 1989 año
2.524 billones
+444.178 bn
21.35%
1 ene 1990 año
2.511 billones
-13.181 bn
-0.52%
1 ene 1991 año
2.576 billones
+64.877 bn
2.58%
1 ene 1992 año
2.911 billones
+335.412 bn
13.02%
1 ene 1993 año
3.147 billones
+235.75 bn
8.1%
1 ene 1994 año
3.582 billones
+434.701 bn
13.81%
1 ene 1995 año
3.92 billones
+338.432 bn
9.45%
1 ene 1996 año
4.339 billones
+418.785 bn
10.68%
1 ene 1997 año
3.85 billones
-489.357 bn
-11.28%
1 ene 1998 año
3.527 billones
-322.61 bn
-8.38%
1 ene 1999 año
3.166 billones
-361.117 bn
-10.24%
1 ene 2000 año
3.579 billones
+413.46 bn
13.06%
1 ene 2001 año
3.833 billones
+253.477 bn
7.08%
1 ene 2002 año
3.384 billones
-448.592 bn
-11.7%
1 ene 2003 año
3.232 billones
-151.895 bn
-4.49%
1 ene 2004 año
3.507 billones
+274.929 bn
8.51%
1 ene 2005 año
3.812 billones
+304.68 bn
8.69%
1 ene 2006 año
3.758 billones
-53.856 bn
-1.41%
1 ene 2007 año
3.586 billones
-171.695 bn
-4.57%
1 ene 2008 año
3.599 billones
+12.443 bn
0.35%
1 ene 2009 año
3.956 billones
+357.033 bn
9.92%
1 ene 2010 año
4.03 billones
+74.338 bn
1.88%
1 ene 2011 año
4.46 billones
+429.834 bn
10.67%
1 ene 2012 año
4.813 billones
+352.898 bn
7.91%
1 ene 2013 año
4.881 billones
+68.308 bn
1.42%
1 ene 2014 año
4.056 billones
-825.511 bn
-16.91%
1 ene 2015 año
3.785 billones
-271.319 bn
-6.69%
Ranking de los países por los datos estadísticos actuales


Comentarios: