29
/es/
es
AIzaSyAYiBZKx7MnpbEhh9jyipgxe19OcubqV5w
April 1, 2024
105624
China
CHN
true
2
1
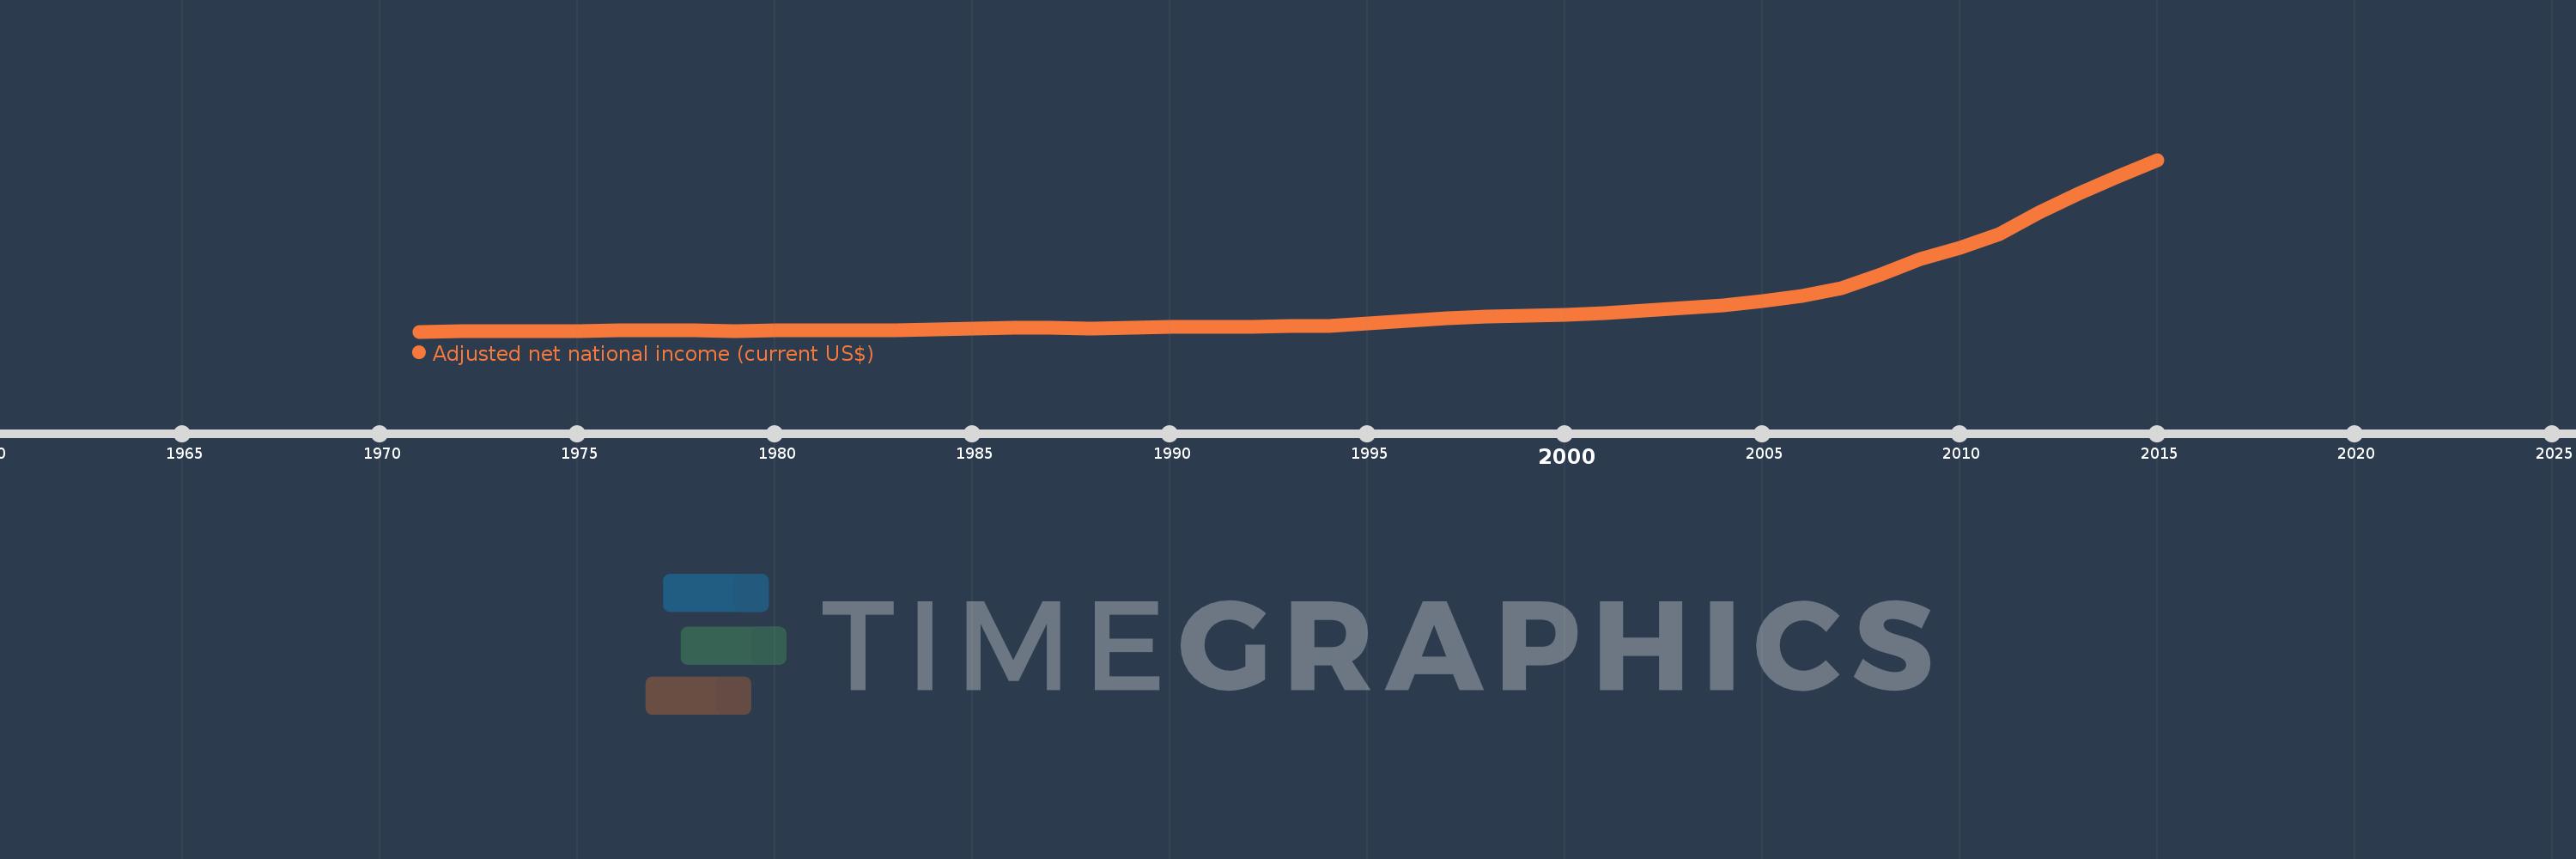
Adjusted net national income (current US$)
2015,2014,2013,2012,2011,2010,2009,2008,2007,2006,2005,2004,2003,2002,2001,2000,1999,1998,1997,1996,1995,1994,1993,1992,1991,1990,1989,1988,1987,1986,1985,1984,1983,1982,1981,1980,1979,1978,1977,1976,1975,1974,1973,1972,1971
Estas estadísticas en otros países:
AfghanistanAlbaniaAlgeriaAngolaArab WorldArgentinaArmeniaAustraliaAustriaAzerbaijanBahamas, TheBahrainBangladeshBarbadosBelarusBelgiumBelizeBeninBhutanBoliviaBotswanaBrazilBrunei DarussalamBulgariaBurkina FasoBurundiCabo VerdeCambodiaCameroonCanadaCaribbean small statesCentral African RepublicCentral Europe and the BalticsChadChileChinaColombiaComorosCongo, Dem. Rep.Congo, Rep.Costa RicaCote d'IvoireCroatiaCubaCyprusCzech RepublicDenmarkDjiboutiDominicaDominican RepublicEarly-demographic dividendEast Asia & PacificEast Asia & Pacific (excluding high income)East Asia & Pacific (IDA & IBRD countries)EcuadorEgypt, Arab Rep.El SalvadorEquatorial GuineaEritreaEstoniaEthiopiaEuro areaEurope & Central AsiaEurope & Central Asia (excluding high income)Europe & Central Asia (IDA & IBRD countries)European UnionFijiFinlandFragile and conflict affected situationsFranceGabonGambia, TheGeorgiaGermanyGhanaGreeceGuatemalaGuineaGuinea-BissauGuyanaHaitiHeavily indebted poor countries (HIPC)High incomeHondurasHong Kong SAR, ChinaHungaryIBRD onlyIcelandIDA & IBRD totalIDA blendIDA onlyIDA totalIndiaIndonesiaIran, Islamic Rep.IraqIrelandIsraelItalyJamaicaJapanJordanKazakhstanKenyaKiribatiKorea, Rep.KuwaitKyrgyz RepublicLao PDRLate-demographic dividendLatin America & Caribbean Latin America & Caribbean (excluding high income)Latin America & the Caribbean (IDA & IBRD countries)LatviaLeast developed countries: UN classificationLebanonLesothoLiberiaLibyaLithuaniaLow & middle incomeLow incomeLower middle incomeLuxembourgMacedonia, FYRMadagascarMalawiMalaysiaMaldivesMaliMauritaniaMauritiusMexicoMiddle East & North AfricaMiddle East & North Africa (excluding high income)Middle East & North Africa (IDA & IBRD countries)Middle incomeMoldovaMongoliaMoroccoMozambiqueMyanmarNamibiaNepalNetherlandsNew ZealandNicaraguaNigerNigeriaNorth AmericaNorwayOECD membersOmanOther small statesPacific island small statesPakistanPanamaPapua New GuineaParaguayPeruPhilippinesPolandPortugalPost-demographic dividendPre-demographic dividendQatarRomaniaRussian FederationRwandaSamoaSao Tome and PrincipeSaudi ArabiaSenegalSeychellesSierra LeoneSingaporeSlovak RepublicSloveniaSmall statesSolomon IslandsSouth AfricaSouth AsiaSouth Asia (IDA & IBRD)SpainSri LankaSt. LuciaSt. Vincent and the GrenadinesSub-Saharan Africa Sub-Saharan Africa (excluding high income)Sub-Saharan Africa (IDA & IBRD countries)SudanSurinameSwazilandSwedenSwitzerlandSyrian Arab RepublicTajikistanTanzaniaThailandTogoTongaTrinidad and TobagoTunisiaTurkeyTurkmenistanUgandaUkraineUnited Arab EmiratesUnited KingdomUnited StatesUpper middle incomeUruguayUzbekistanVanuatuVenezuela, RBVietnamWorldYemen, Rep.ZambiaZimbabwe línea de tiempo (timeline):
En esta escala de tiempo se presenta un gráfico de 1971 y 2015 de China. Los datos de 1970 están ausentes. El número de observaciones reales por fecha: 45.
Fuente (nombre):
Indicadores del desarrollo mundial
Fuente (organización):
World Bank staff estimates based on sources and methods in World Bank's "The Changing Wealth of Nations: Measuring Sustainable Development in the New Millennium" (2011).
Categorías:
Economy & Growth
Se ha actualizado:
23 abr 2017 año
Los indicadores de los cambios de valor en los últimos años
En promedio:
1.462 billones
Mínimo:
82.832 bn
1 ene 1971 año
Máximo:
8.758 billones
1 ene 2015 año
A la fecha de observación
Valor
Cambio absoluto
El cambio con respecto al valor anterior
1 ene 1971 año
82.832 bn
+82.832 bn
0.0%
1 ene 1972 año
89.054 bn
+6.222 bn
7.51%
1 ene 1973 año
100.788 bn
+11.735 bn
13.18%
1 ene 1974 año
122.176 bn
+21.388 bn
21.22%
1 ene 1975 año
123.651 bn
+1.475 bn
1.21%
1 ene 1976 año
138.23 bn
+14.579 bn
11.79%
1 ene 1977 año
126.566 bn
-11.664 bn
-8.44%
1 ene 1978 año
143.608 bn
+17.042 bn
13.47%
1 ene 1979 año
122.347 bn
-21.261 bn
-14.81%
1 ene 1980 año
137.077 bn
+14.73 bn
12.04%
1 ene 1981 año
143.592 bn
+6.516 bn
4.75%
1 ene 1982 año
144.485 bn
+892.489 millones
0.62%
1 ene 1983 año
154.488 bn
+10.003 bn
6.92%
1 ene 1984 año
185.858 bn
+31.369 bn
20.31%
1 ene 1985 año
215.103 bn
+29.245 bn
15.74%
1 ene 1986 año
259.82 bn
+44.717 bn
20.79%
1 ene 1987 año
259.97 bn
+150.471 millones
0.06%
1 ene 1988 año
232.868 bn
-27.102 bn
-10.43%
1 ene 1989 año
272.287 bn
+39.419 bn
16.93%
1 ene 1990 año
301.313 bn
+29.026 bn
10.66%
1 ene 1991 año
306.742 bn
+5.429 bn
1.8%
1 ene 1992 año
329.142 bn
+22.4 bn
7.3%
1 ene 1993 año
370.652 bn
+41.509 bn
12.61%
1 ene 1994 año
382.937 bn
+12.285 bn
3.31%
1 ene 1995 año
490.53 bn
+107.593 bn
28.1%
1 ene 1996 año
628.981 bn
+138.451 bn
28.22%
1 ene 1997 año
739.911 bn
+110.93 bn
17.64%
1 ene 1998 año
829.487 bn
+89.576 bn
12.11%
1 ene 1999 año
889.488 bn
+60.001 bn
7.23%
1 ene 2000 año
944.762 bn
+55.274 bn
6.21%
1 ene 2001 año
1.035 billones
+90.487 bn
9.58%
1 ene 2002 año
1.144 billones
+108.356 bn
10.47%
1 ene 2003 año
1.262 billones
+118.316 bn
10.35%
1 ene 2004 año
1.426 billones
+163.932 bn
12.99%
1 ene 2005 año
1.644 billones
+218.265 bn
15.31%
1 ene 2006 año
1.9 billones
+255.777 bn
15.56%
1 ene 2007 año
2.285 billones
+384.658 bn
20.25%
1 ene 2008 año
2.952 billones
+667.107 bn
29.2%
1 ene 2009 año
3.731 billones
+779.282 bn
26.4%
1 ene 2010 año
4.317 billones
+586.479 bn
15.72%
1 ene 2011 año
5.018 billones
+700.84 bn
16.23%
1 ene 2012 año
6.08 billones
+1.062 billones
21.16%
1 ene 2013 año
7.055 billones
+975.348 bn
16.04%
1 ene 2014 año
7.893 billones
+837.244 bn
11.87%
1 ene 2015 año
8.758 billones
+865.188 bn
10.96%
Ranking de los países por los datos estadísticos actuales


Comentarios: