29
/es/
es
AIzaSyAYiBZKx7MnpbEhh9jyipgxe19OcubqV5w
April 1, 2024
26258
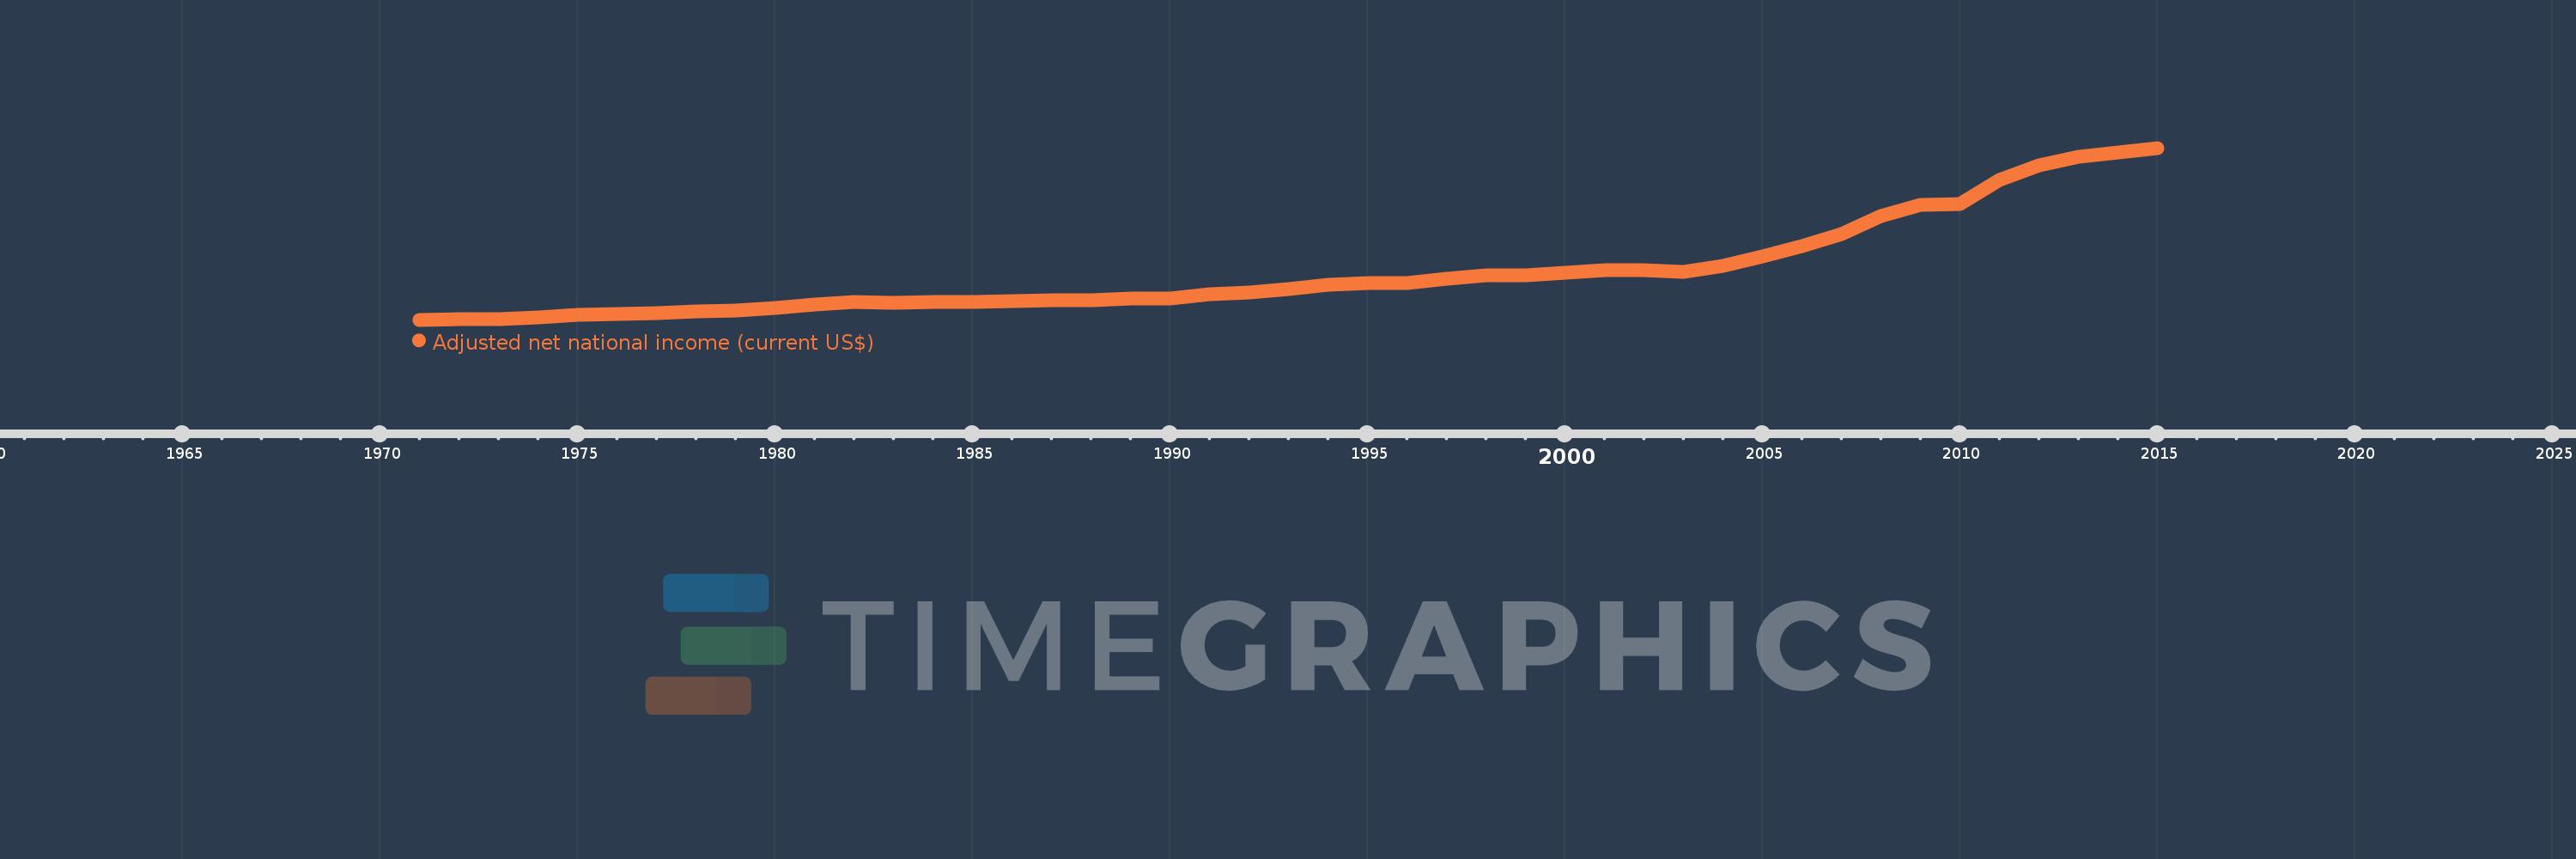
Early-demographic dividend
EAR
false
2
1
Adjusted net national income (current US$)
2015,2014,2013,2012,2011,2010,2009,2008,2007,2006,2005,2004,2003,2002,2001,2000,1999,1998,1997,1996,1995,1994,1993,1992,1991,1990,1989,1988,1987,1986,1985,1984,1983,1982,1981,1980,1979,1978,1977,1976,1975,1974,1973,1972,1971
Estas estadísticas en otros países:
AfghanistanAlbaniaAlgeriaAngolaArab WorldArgentinaArmeniaAustraliaAustriaAzerbaijanBahamas, TheBahrainBangladeshBarbadosBelarusBelgiumBelizeBeninBhutanBoliviaBotswanaBrazilBrunei DarussalamBulgariaBurkina FasoBurundiCabo VerdeCambodiaCameroonCanadaCaribbean small statesCentral African RepublicCentral Europe and the BalticsChadChileChinaColombiaComorosCongo, Dem. Rep.Congo, Rep.Costa RicaCote d'IvoireCroatiaCubaCyprusCzech RepublicDenmarkDjiboutiDominicaDominican RepublicEarly-demographic dividendEast Asia & PacificEast Asia & Pacific (excluding high income)East Asia & Pacific (IDA & IBRD countries)EcuadorEgypt, Arab Rep.El SalvadorEquatorial GuineaEritreaEstoniaEthiopiaEuro areaEurope & Central AsiaEurope & Central Asia (excluding high income)Europe & Central Asia (IDA & IBRD countries)European UnionFijiFinlandFragile and conflict affected situationsFranceGabonGambia, TheGeorgiaGermanyGhanaGreeceGuatemalaGuineaGuinea-BissauGuyanaHaitiHeavily indebted poor countries (HIPC)High incomeHondurasHong Kong SAR, ChinaHungaryIBRD onlyIcelandIDA & IBRD totalIDA blendIDA onlyIDA totalIndiaIndonesiaIran, Islamic Rep.IraqIrelandIsraelItalyJamaicaJapanJordanKazakhstanKenyaKiribatiKorea, Rep.KuwaitKyrgyz RepublicLao PDRLate-demographic dividendLatin America & Caribbean Latin America & Caribbean (excluding high income)Latin America & the Caribbean (IDA & IBRD countries)LatviaLeast developed countries: UN classificationLebanonLesothoLiberiaLibyaLithuaniaLow & middle incomeLow incomeLower middle incomeLuxembourgMacedonia, FYRMadagascarMalawiMalaysiaMaldivesMaliMauritaniaMauritiusMexicoMiddle East & North AfricaMiddle East & North Africa (excluding high income)Middle East & North Africa (IDA & IBRD countries)Middle incomeMoldovaMongoliaMoroccoMozambiqueMyanmarNamibiaNepalNetherlandsNew ZealandNicaraguaNigerNigeriaNorth AmericaNorwayOECD membersOmanOther small statesPacific island small statesPakistanPanamaPapua New GuineaParaguayPeruPhilippinesPolandPortugalPost-demographic dividendPre-demographic dividendQatarRomaniaRussian FederationRwandaSamoaSao Tome and PrincipeSaudi ArabiaSenegalSeychellesSierra LeoneSingaporeSlovak RepublicSloveniaSmall statesSolomon IslandsSouth AfricaSouth AsiaSouth Asia (IDA & IBRD)SpainSri LankaSt. LuciaSt. Vincent and the GrenadinesSub-Saharan Africa Sub-Saharan Africa (excluding high income)Sub-Saharan Africa (IDA & IBRD countries)SudanSurinameSwazilandSwedenSwitzerlandSyrian Arab RepublicTajikistanTanzaniaThailandTogoTongaTrinidad and TobagoTunisiaTurkeyTurkmenistanUgandaUkraineUnited Arab EmiratesUnited KingdomUnited StatesUpper middle incomeUruguayUzbekistanVanuatuVenezuela, RBVietnamWorldYemen, Rep.ZambiaZimbabwe línea de tiempo (timeline):
En esta escala de tiempo se presenta un gráfico de 1971 y 2015 de Early-demographic dividend. Los datos de 1970 están ausentes. El número de observaciones reales por fecha: 45.
Fuente (nombre):
Indicadores del desarrollo mundial
Fuente (organización):
World Bank staff estimates based on sources and methods in World Bank's "The Changing Wealth of Nations: Measuring Sustainable Development in the New Millennium" (2011).
Categorías:
Economy & Growth
Se ha actualizado:
23 abr 2017 año
Los indicadores de los cambios de valor en los últimos años
En promedio:
2.619 billones
Mínimo:
241.823 bn
1 ene 1971 año
Máximo:
8.759 billones
1 ene 2015 año
A la fecha de observación
Valor
Cambio absoluto
El cambio con respecto al valor anterior
1 ene 1971 año
241.823 bn
+241.823 bn
0.0%
1 ene 1972 año
263.53 bn
+21.707 bn
8.98%
1 ene 1973 año
291.998 bn
+28.467 bn
10.8%
1 ene 1974 año
368.768 bn
+76.77 bn
26.29%
1 ene 1975 año
488.114 bn
+119.346 bn
32.36%
1 ene 1976 año
535.261 bn
+47.147 bn
9.66%
1 ene 1977 año
578.857 bn
+43.596 bn
8.14%
1 ene 1978 año
644.805 bn
+65.947 bn
11.39%
1 ene 1979 año
716.771 bn
+71.966 bn
11.16%
1 ene 1980 año
818.648 bn
+101.878 bn
14.21%
1 ene 1981 año
992.296 bn
+173.648 bn
21.21%
1 ene 1982 año
1.138 billones
+145.745 bn
14.69%
1 ene 1983 año
1.09 billones
-47.8 bn
-4.2%
1 ene 1984 año
1.124 billones
+34.089 bn
3.13%
1 ene 1985 año
1.107 billones
-17.461 bn
-1.55%
1 ene 1986 año
1.146 billones
+39.603 bn
3.58%
1 ene 1987 año
1.187 billones
+40.852 bn
3.56%
1 ene 1988 año
1.187 billones
-112.19 millones
-0.01%
1 ene 1989 año
1.289 billones
+101.555 bn
8.55%
1 ene 1990 año
1.307 billones
+18.498 bn
1.44%
1 ene 1991 año
1.488 billones
+180.962 bn
13.84%
1 ene 1992 año
1.579 billones
+90.691 bn
6.09%
1 ene 1993 año
1.753 billones
+174.059 bn
11.02%
1 ene 1994 año
1.957 billones
+203.683 bn
11.62%
1 ene 1995 año
2.052 billones
+95.623 bn
4.89%
1 ene 1996 año
2.077 billones
+25.17 bn
1.23%
1 ene 1997 año
2.264 billones
+186.796 bn
8.99%
1 ene 1998 año
2.444 billones
+180.091 bn
7.95%
1 ene 1999 año
2.441 billones
-2.993 bn
-0.12%
1 ene 2000 año
2.564 billones
+122.311 bn
5.01%
1 ene 2001 año
2.715 billones
+150.858 bn
5.88%
1 ene 2002 año
2.7 billones
-14.154 bn
-0.52%
1 ene 2003 año
2.633 billones
-67.615 bn
-2.5%
1 ene 2004 año
2.926 billones
+293.058 bn
11.13%
1 ene 2005 año
3.396 billones
+470.018 bn
16.06%
1 ene 2006 año
3.902 billones
+506.169 bn
14.91%
1 ene 2007 año
4.469 billones
+567.453 bn
14.54%
1 ene 2008 año
5.372 billones
+902.47 bn
20.19%
1 ene 2009 año
5.923 billones
+550.849 bn
10.25%
1 ene 2010 año
5.977 billones
+54.306 bn
0.92%
1 ene 2011 año
7.189 billones
+1.212 billones
20.27%
1 ene 2012 año
7.912 billones
+723.518 bn
10.06%
1 ene 2013 año
8.33 billones
+418.064 bn
5.28%
1 ene 2014 año
8.514 billones
+183.634 bn
2.2%
1 ene 2015 año
8.759 billones
+244.701 bn
2.87%
Ranking de los países por los datos estadísticos actuales


Comentarios: