29
/es/
es
AIzaSyAYiBZKx7MnpbEhh9jyipgxe19OcubqV5w
April 1, 2024
60868
Sub-Saharan Africa (IDA & IBRD countries)
TSS
false
2
1
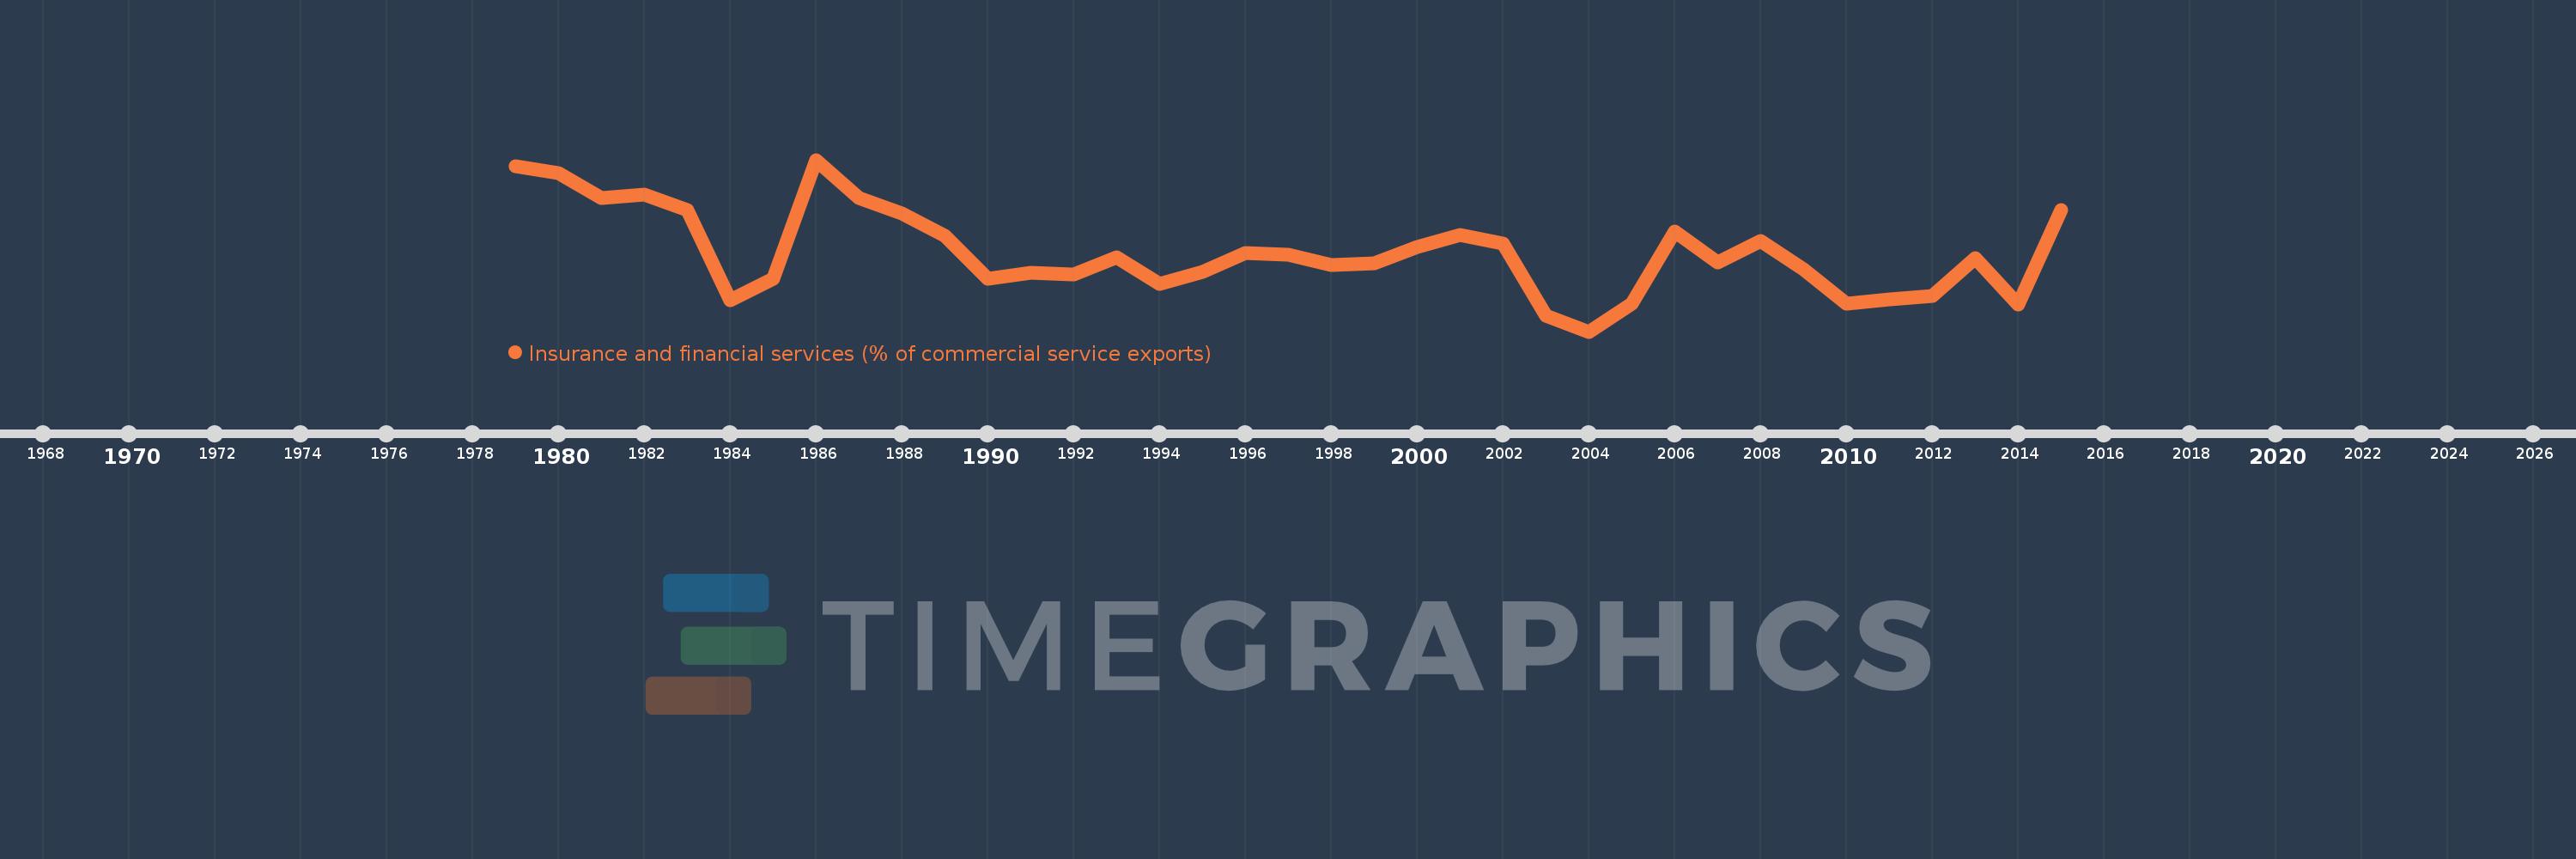
Insurance and financial services (% of commercial service exports)
2015,2014,2013,2012,2011,2010,2009,2008,2007,2006,2005,2004,2003,2002,2001,2000,1999,1998,1997,1996,1995,1994,1993,1992,1991,1990,1989,1988,1987,1986,1985,1984,1983,1982,1981,1980,1979
Estas estadísticas en otros países:
AfghanistanAlbaniaAlgeriaAngolaAntigua and BarbudaArab WorldArgentinaArmeniaArubaAustraliaAustriaAzerbaijanBahrainBangladeshBarbadosBelarusBelgiumBelizeBeninBermudaBhutanBoliviaBosnia and HerzegovinaBotswanaBrazilBrunei DarussalamBulgariaBurkina FasoBurundiCabo VerdeCambodiaCameroonCanadaCaribbean small statesCentral African RepublicCentral Europe and the BalticsChadChileChinaColombiaComorosCongo, Dem. Rep.Congo, Rep.Costa RicaCote d'IvoireCroatiaCuracaoCyprusCzech RepublicDenmarkDominicaDominican RepublicEarly-demographic dividendEast Asia & PacificEast Asia & Pacific (excluding high income)East Asia & Pacific (IDA & IBRD countries)EcuadorEgypt, Arab Rep.El SalvadorEritreaEstoniaEthiopiaEuro areaEurope & Central AsiaEurope & Central Asia (excluding high income)Europe & Central Asia (IDA & IBRD countries)European UnionFaroe IslandsFijiFinlandFragile and conflict affected situationsFranceFrench PolynesiaGabonGambia, TheGeorgiaGermanyGhanaGreeceGrenadaGuatemalaGuineaGuinea-BissauGuyanaHaitiHeavily indebted poor countries (HIPC)High incomeHondurasHong Kong SAR, ChinaHungaryIBRD onlyIcelandIDA & IBRD totalIDA onlyIDA totalIndiaIndonesiaIran, Islamic Rep.IraqIrelandIsraelItalyJamaicaJapanJordanKazakhstanKenyaKiribatiKorea, Rep.KosovoKuwaitKyrgyz RepublicLao PDRLate-demographic dividendLatin America & Caribbean Latin America & Caribbean (excluding high income)Latin America & the Caribbean (IDA & IBRD countries)LatviaLeast developed countries: UN classificationLebanonLesothoLiberiaLibyaLithuaniaLow & middle incomeLow incomeLower middle incomeLuxembourgMacao SAR, ChinaMacedonia, FYRMadagascarMalawiMalaysiaMaldivesMaliMaltaMauritaniaMauritiusMexicoMiddle East & North AfricaMiddle East & North Africa (excluding high income)Middle East & North Africa (IDA & IBRD countries)Middle incomeMoldovaMongoliaMontenegroMoroccoMozambiqueMyanmarNamibiaNepalNetherlandsNew CaledoniaNew ZealandNicaraguaNigerNigeriaNorth AmericaNorwayOECD membersOmanOther small statesPacific island small statesPakistanPalauPanamaPapua New GuineaParaguayPeruPhilippinesPolandPortugalPost-demographic dividendPre-demographic dividendQatarRomaniaRussian FederationRwandaSamoaSao Tome and PrincipeSaudi ArabiaSenegalSerbiaSeychellesSierra LeoneSingaporeSint Maarten (Dutch part)Slovak RepublicSloveniaSmall statesSolomon IslandsSouth AfricaSouth AsiaSouth Asia (IDA & IBRD)South SudanSpainSri LankaSt. Kitts and NevisSt. LuciaSt. Vincent and the GrenadinesSub-Saharan Africa Sub-Saharan Africa (excluding high income)Sub-Saharan Africa (IDA & IBRD countries)SudanSurinameSwazilandSwedenSwitzerlandSyrian Arab RepublicTajikistanTanzaniaThailandTimor-LesteTogoTongaTrinidad and TobagoTunisiaTurkeyTuvaluUgandaUkraineUnited KingdomUnited StatesUpper middle incomeUruguayVanuatuVenezuela, RBWest Bank and GazaWorldZambiaZimbabwe línea de tiempo (timeline):
En esta escala de tiempo se presenta un gráfico de 1979 y 2015 de Sub-Saharan Africa (IDA & IBRD countries). Los datos de 1978 están ausentes. El número de observaciones reales por fecha: 37.
Fuente (nombre):
Indicadores del desarrollo mundial
Fuente (organización):
International Monetary Fund, Balance of Payments Statistics Yearbook and data files.
Categorías:
Private Sector, Trade
Se ha actualizado:
23 abr 2017 año
Los indicadores de los cambios de valor en los últimos años
Mínimo:
3.485
1 ene 2004 año
Máximo:
7.602
1 ene 1986 año
A la fecha de observación
Valor
Cambio absoluto
El cambio con respecto al valor anterior
1 ene 1979 año
7.451
+7.451
0.0%
1 ene 1980 año
7.288
-0.163
-2.19%
1 ene 1981 año
6.68
-0.607
-8.33%
1 ene 1982 año
6.778
+0.097
1.46%
1 ene 1983 año
6.405
-0.373
-5.5%
1 ene 1984 año
4.239
-2.166
-33.82%
1 ene 1985 año
4.743
+0.505
11.91%
1 ene 1986 año
7.602
+2.859
60.27%
1 ene 1987 año
6.688
-0.915
-12.03%
1 ene 1988 año
6.321
-0.366
-5.48%
1 ene 1989 año
5.783
-0.539
-8.52%
1 ene 1990 año
4.748
-1.034
-17.88%
1 ene 1991 año
4.905
+0.157
3.3%
1 ene 1992 año
4.851
-0.054
-1.11%
1 ene 1993 año
5.26
+0.409
8.43%
1 ene 1994 año
4.622
-0.638
-12.12%
1 ene 1995 año
4.917
+0.295
6.38%
1 ene 1996 año
5.373
+0.456
9.27%
1 ene 1997 año
5.326
-0.047
-0.88%
1 ene 1998 año
5.08
-0.245
-4.61%
1 ene 1999 año
5.114
+0.033
0.66%
1 ene 2000 año
5.515
+0.402
7.85%
1 ene 2001 año
5.803
+0.287
5.21%
1 ene 2002 año
5.594
-0.209
-3.6%
1 ene 2003 año
3.86
-1.733
-30.99%
1 ene 2004 año
3.485
-0.375
-9.72%
1 ene 2005 año
4.156
+0.671
19.25%
1 ene 2006 año
5.888
+1.732
41.67%
1 ene 2007 año
5.146
-0.742
-12.59%
1 ene 2008 año
5.663
+0.517
10.04%
1 ene 2009 año
4.987
-0.676
-11.94%
1 ene 2010 año
4.146
-0.841
-16.86%
1 ene 2011 año
4.252
+0.107
2.57%
1 ene 2012 año
4.348
+0.096
2.25%
1 ene 2013 año
5.237
+0.889
20.44%
1 ene 2014 año
4.143
-1.094
-20.88%
1 ene 2015 año
6.398
+2.255
54.42%
Ranking de los países por los datos estadísticos actuales


Comentarios: