29
/es/
es
AIzaSyAYiBZKx7MnpbEhh9jyipgxe19OcubqV5w
April 1, 2024
240582
Singapore
SGP
true
2
1
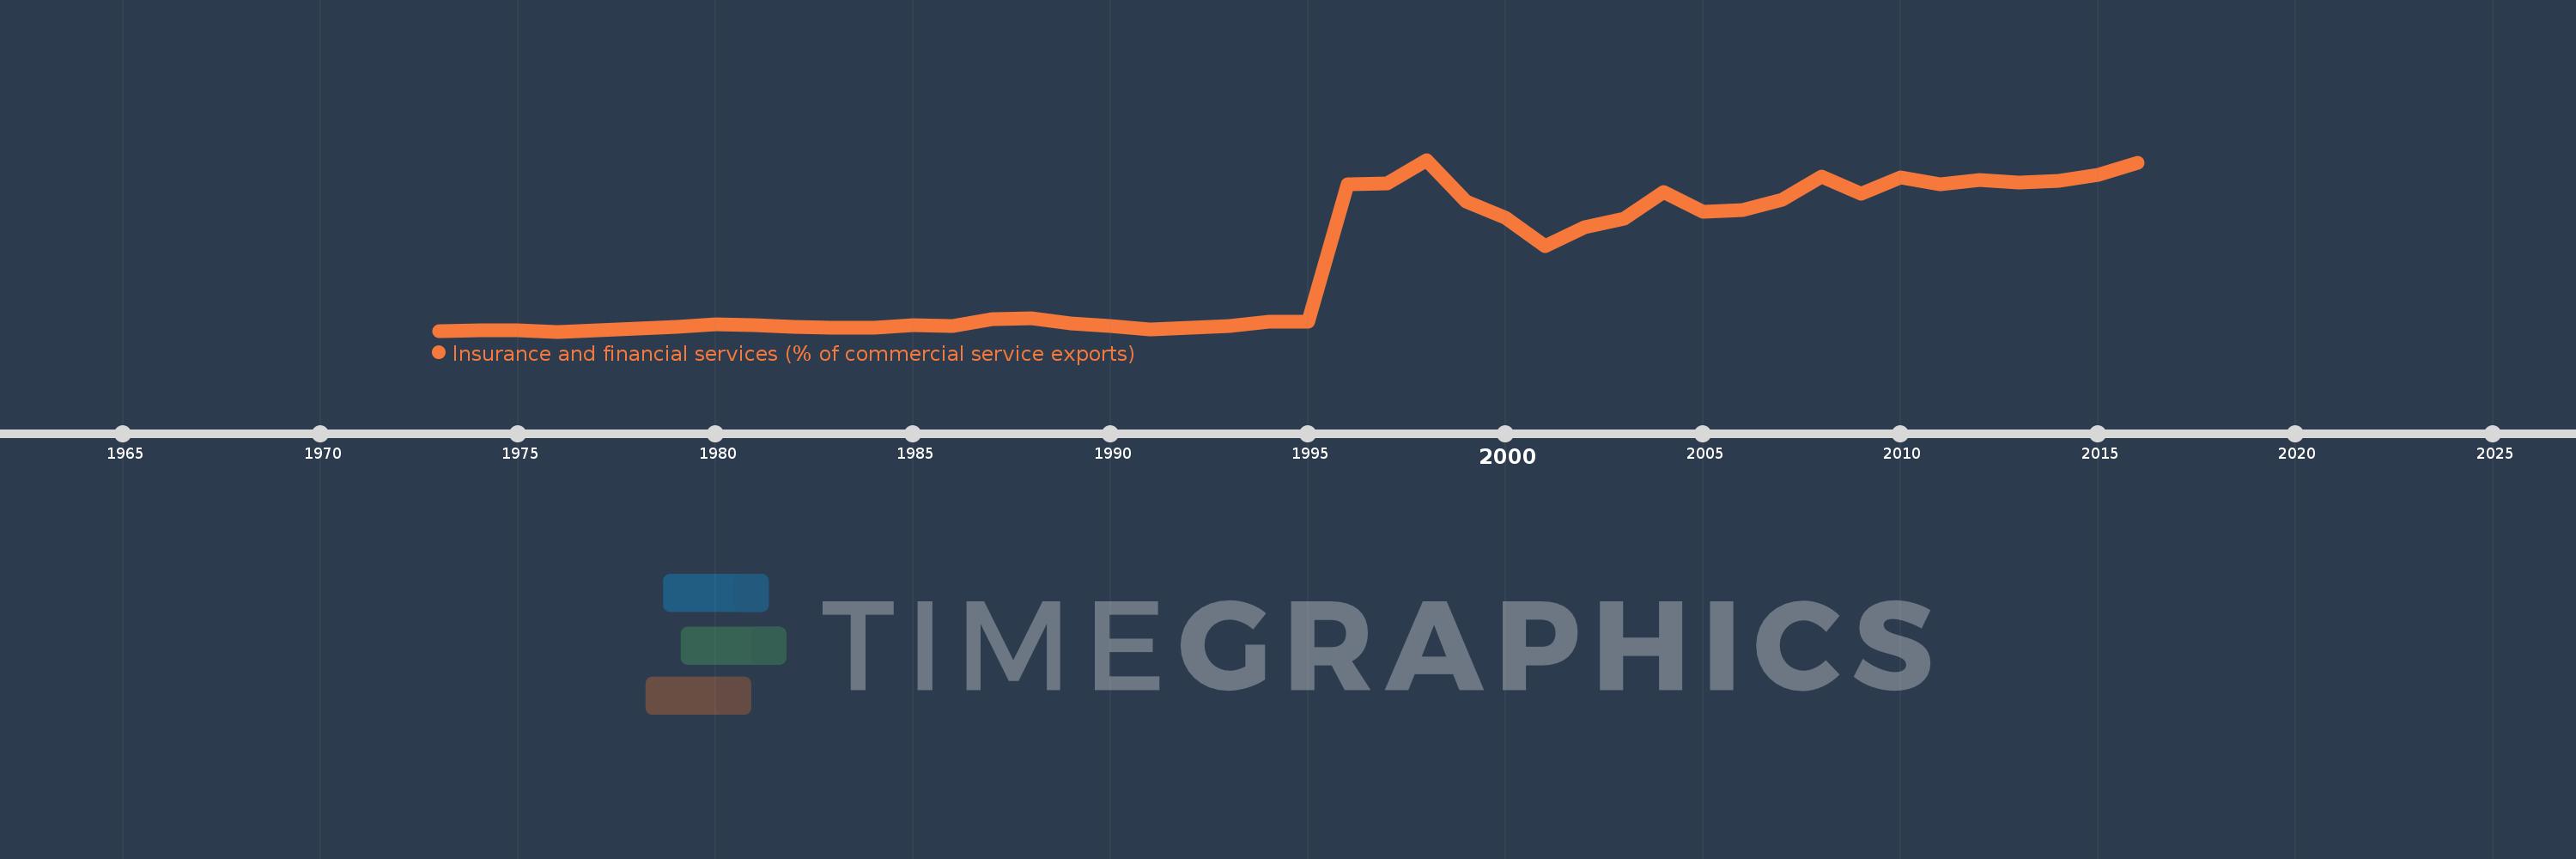
Insurance and financial services (% of commercial service exports)
2016,2015,2014,2013,2012,2011,2010,2009,2008,2007,2006,2005,2004,2003,2002,2001,2000,1999,1998,1997,1996,1995,1994,1993,1992,1991,1990,1989,1988,1987,1986,1985,1984,1983,1982,1981,1980,1979,1978,1977,1976,1975,1974,1973
Estas estadísticas en otros países:
AfghanistanAlbaniaAlgeriaAngolaAntigua and BarbudaArab WorldArgentinaArmeniaArubaAustraliaAustriaAzerbaijanBahrainBangladeshBarbadosBelarusBelgiumBelizeBeninBermudaBhutanBoliviaBosnia and HerzegovinaBotswanaBrazilBrunei DarussalamBulgariaBurkina FasoBurundiCabo VerdeCambodiaCameroonCanadaCaribbean small statesCentral African RepublicCentral Europe and the BalticsChadChileChinaColombiaComorosCongo, Dem. Rep.Congo, Rep.Costa RicaCote d'IvoireCroatiaCuracaoCyprusCzech RepublicDenmarkDominicaDominican RepublicEarly-demographic dividendEast Asia & PacificEast Asia & Pacific (excluding high income)East Asia & Pacific (IDA & IBRD countries)EcuadorEgypt, Arab Rep.El SalvadorEritreaEstoniaEthiopiaEuro areaEurope & Central AsiaEurope & Central Asia (excluding high income)Europe & Central Asia (IDA & IBRD countries)European UnionFaroe IslandsFijiFinlandFragile and conflict affected situationsFranceFrench PolynesiaGabonGambia, TheGeorgiaGermanyGhanaGreeceGrenadaGuatemalaGuineaGuinea-BissauGuyanaHaitiHeavily indebted poor countries (HIPC)High incomeHondurasHong Kong SAR, ChinaHungaryIBRD onlyIcelandIDA & IBRD totalIDA onlyIDA totalIndiaIndonesiaIran, Islamic Rep.IraqIrelandIsraelItalyJamaicaJapanJordanKazakhstanKenyaKiribatiKorea, Rep.KosovoKuwaitKyrgyz RepublicLao PDRLate-demographic dividendLatin America & Caribbean Latin America & Caribbean (excluding high income)Latin America & the Caribbean (IDA & IBRD countries)LatviaLeast developed countries: UN classificationLebanonLesothoLiberiaLibyaLithuaniaLow & middle incomeLow incomeLower middle incomeLuxembourgMacao SAR, ChinaMacedonia, FYRMadagascarMalawiMalaysiaMaldivesMaliMaltaMauritaniaMauritiusMexicoMiddle East & North AfricaMiddle East & North Africa (excluding high income)Middle East & North Africa (IDA & IBRD countries)Middle incomeMoldovaMongoliaMontenegroMoroccoMozambiqueMyanmarNamibiaNepalNetherlandsNew CaledoniaNew ZealandNicaraguaNigerNigeriaNorth AmericaNorwayOECD membersOmanOther small statesPacific island small statesPakistanPalauPanamaPapua New GuineaParaguayPeruPhilippinesPolandPortugalPost-demographic dividendPre-demographic dividendQatarRomaniaRussian FederationRwandaSamoaSao Tome and PrincipeSaudi ArabiaSenegalSerbiaSeychellesSierra LeoneSingaporeSint Maarten (Dutch part)Slovak RepublicSloveniaSmall statesSolomon IslandsSouth AfricaSouth AsiaSouth Asia (IDA & IBRD)South SudanSpainSri LankaSt. Kitts and NevisSt. LuciaSt. Vincent and the GrenadinesSub-Saharan Africa Sub-Saharan Africa (excluding high income)Sub-Saharan Africa (IDA & IBRD countries)SudanSurinameSwazilandSwedenSwitzerlandSyrian Arab RepublicTajikistanTanzaniaThailandTimor-LesteTogoTongaTrinidad and TobagoTunisiaTurkeyTuvaluUgandaUkraineUnited KingdomUnited StatesUpper middle incomeUruguayVanuatuVenezuela, RBWest Bank and GazaWorldZambiaZimbabwe línea de tiempo (timeline):
En esta escala de tiempo se presenta un gráfico de 1973 y 2016 de Singapore. Los datos de 1972 están ausentes. El número de observaciones reales por fecha: 44.
Fuente (nombre):
Indicadores del desarrollo mundial
Fuente (organización):
International Monetary Fund, Balance of Payments Statistics Yearbook and data files.
Categorías:
Private Sector, Trade
Se ha actualizado:
23 abr 2017 año
Los indicadores de los cambios de valor en los últimos años
Mínimo:
0.433
1 ene 1976 año
Máximo:
18.181
1 ene 1998 año
A la fecha de observación
Valor
Cambio absoluto
El cambio con respecto al valor anterior
1 ene 1973 año
0.436
+0.436
0.0%
1 ene 1974 año
0.535
+0.099
22.64%
1 ene 1975 año
0.556
+0.021
3.97%
1 ene 1976 año
0.433
-0.124
-22.22%
1 ene 1977 año
0.609
+0.177
40.86%
1 ene 1978 año
0.771
+0.161
26.48%
1 ene 1979 año
0.942
+0.171
22.21%
1 ene 1980 año
1.154
+0.212
22.55%
1 ene 1981 año
1.125
-0.029
-2.55%
1 ene 1982 año
0.908
-0.216
-19.25%
1 ene 1983 año
0.839
-0.07
-7.68%
1 ene 1984 año
0.875
+0.037
4.36%
1 ene 1985 año
1.14
+0.265
30.28%
1 ene 1986 año
1.038
-0.102
-8.95%
1 ene 1987 año
1.714
+0.676
65.07%
1 ene 1988 año
1.765
+0.051
2.99%
1 ene 1989 año
1.318
-0.447
-25.34%
1 ene 1990 año
0.999
-0.319
-24.2%
1 ene 1991 año
0.695
-0.303
-30.38%
1 ene 1992 año
0.832
+0.137
19.69%
1 ene 1993 año
1.042
+0.21
25.24%
1 ene 1994 año
1.415
+0.373
35.78%
1 ene 1995 año
1.438
+0.023
1.59%
1 ene 1996 año
15.618
+14.18
986.2%
1 ene 1997 año
15.707
+0.089
0.57%
1 ene 1998 año
18.181
+2.473
15.75%
1 ene 1999 año
13.857
-4.324
-23.78%
1 ene 2000 año
12.185
-1.672
-12.06%
1 ene 2001 año
9.304
-2.881
-23.64%
1 ene 2002 año
11.199
+1.895
20.37%
1 ene 2003 año
12.138
+0.939
8.38%
1 ene 2004 año
14.828
+2.689
22.15%
1 ene 2005 año
12.854
-1.974
-13.31%
1 ene 2006 año
12.965
+0.111
0.86%
1 ene 2007 año
14.058
+1.093
8.43%
1 ene 2008 año
16.443
+2.385
16.96%
1 ene 2009 año
14.672
-1.771
-10.77%
1 ene 2010 año
16.386
+1.715
11.69%
1 ene 2011 año
15.66
-0.726
-4.43%
1 ene 2012 año
16.074
+0.414
2.65%
1 ene 2013 año
15.857
-0.218
-1.35%
1 ene 2014 año
16.04
+0.184
1.16%
1 ene 2015 año
16.657
+0.617
3.85%
1 ene 2016 año
17.846
+1.189
7.14%
Ranking de los países por los datos estadísticos actuales


Comentarios: