29
/es/
es
AIzaSyAYiBZKx7MnpbEhh9jyipgxe19OcubqV5w
April 1, 2024
248876
Sri Lanka
LKA
true
2
1
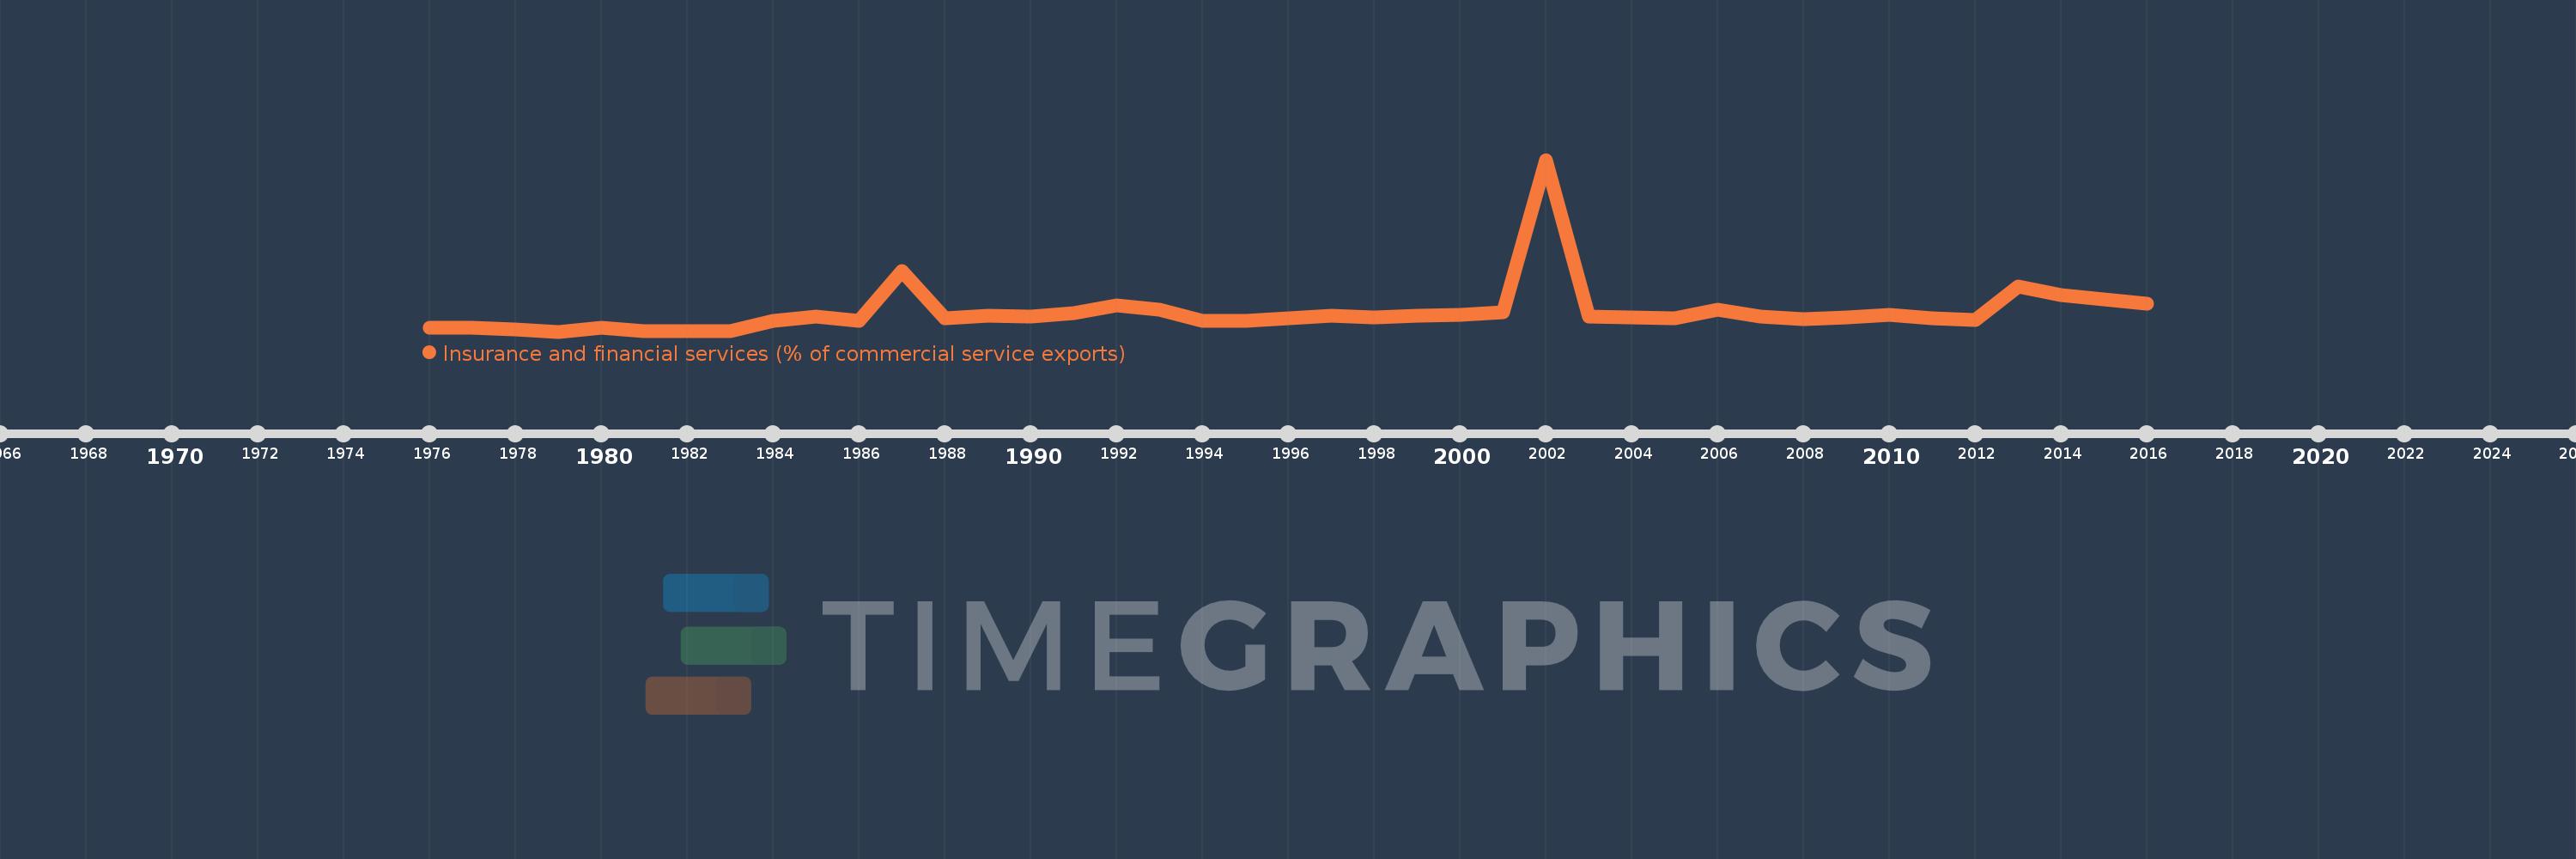
Insurance and financial services (% of commercial service exports)
2016,2015,2014,2013,2012,2011,2010,2009,2008,2007,2006,2005,2004,2003,2002,2001,2000,1999,1998,1997,1996,1995,1994,1993,1992,1991,1990,1989,1988,1987,1986,1985,1984,1983,1982,1981,1980,1979,1978,1977,1976
Estas estadísticas en otros países:
AfghanistanAlbaniaAlgeriaAngolaAntigua and BarbudaArab WorldArgentinaArmeniaArubaAustraliaAustriaAzerbaijanBahrainBangladeshBarbadosBelarusBelgiumBelizeBeninBermudaBhutanBoliviaBosnia and HerzegovinaBotswanaBrazilBrunei DarussalamBulgariaBurkina FasoBurundiCabo VerdeCambodiaCameroonCanadaCaribbean small statesCentral African RepublicCentral Europe and the BalticsChadChileChinaColombiaComorosCongo, Dem. Rep.Congo, Rep.Costa RicaCote d'IvoireCroatiaCuracaoCyprusCzech RepublicDenmarkDominicaDominican RepublicEarly-demographic dividendEast Asia & PacificEast Asia & Pacific (excluding high income)East Asia & Pacific (IDA & IBRD countries)EcuadorEgypt, Arab Rep.El SalvadorEritreaEstoniaEthiopiaEuro areaEurope & Central AsiaEurope & Central Asia (excluding high income)Europe & Central Asia (IDA & IBRD countries)European UnionFaroe IslandsFijiFinlandFragile and conflict affected situationsFranceFrench PolynesiaGabonGambia, TheGeorgiaGermanyGhanaGreeceGrenadaGuatemalaGuineaGuinea-BissauGuyanaHaitiHeavily indebted poor countries (HIPC)High incomeHondurasHong Kong SAR, ChinaHungaryIBRD onlyIcelandIDA & IBRD totalIDA onlyIDA totalIndiaIndonesiaIran, Islamic Rep.IraqIrelandIsraelItalyJamaicaJapanJordanKazakhstanKenyaKiribatiKorea, Rep.KosovoKuwaitKyrgyz RepublicLao PDRLate-demographic dividendLatin America & Caribbean Latin America & Caribbean (excluding high income)Latin America & the Caribbean (IDA & IBRD countries)LatviaLeast developed countries: UN classificationLebanonLesothoLiberiaLibyaLithuaniaLow & middle incomeLow incomeLower middle incomeLuxembourgMacao SAR, ChinaMacedonia, FYRMadagascarMalawiMalaysiaMaldivesMaliMaltaMauritaniaMauritiusMexicoMiddle East & North AfricaMiddle East & North Africa (excluding high income)Middle East & North Africa (IDA & IBRD countries)Middle incomeMoldovaMongoliaMontenegroMoroccoMozambiqueMyanmarNamibiaNepalNetherlandsNew CaledoniaNew ZealandNicaraguaNigerNigeriaNorth AmericaNorwayOECD membersOmanOther small statesPacific island small statesPakistanPalauPanamaPapua New GuineaParaguayPeruPhilippinesPolandPortugalPost-demographic dividendPre-demographic dividendQatarRomaniaRussian FederationRwandaSamoaSao Tome and PrincipeSaudi ArabiaSenegalSerbiaSeychellesSierra LeoneSingaporeSint Maarten (Dutch part)Slovak RepublicSloveniaSmall statesSolomon IslandsSouth AfricaSouth AsiaSouth Asia (IDA & IBRD)South SudanSpainSri LankaSt. Kitts and NevisSt. LuciaSt. Vincent and the GrenadinesSub-Saharan Africa Sub-Saharan Africa (excluding high income)Sub-Saharan Africa (IDA & IBRD countries)SudanSurinameSwazilandSwedenSwitzerlandSyrian Arab RepublicTajikistanTanzaniaThailandTimor-LesteTogoTongaTrinidad and TobagoTunisiaTurkeyTuvaluUgandaUkraineUnited KingdomUnited StatesUpper middle incomeUruguayVanuatuVenezuela, RBWest Bank and GazaWorldZambiaZimbabwe línea de tiempo (timeline):
En esta escala de tiempo se presenta un gráfico de 1976 y 2016 de Sri Lanka. Los datos de 1975 están ausentes. El número de observaciones reales por fecha: 41.
Fuente (nombre):
Indicadores del desarrollo mundial
Fuente (organización):
International Monetary Fund, Balance of Payments Statistics Yearbook and data files.
Categorías:
Private Sector, Trade
Se ha actualizado:
23 abr 2017 año
Los indicadores de los cambios de valor en los últimos años
Mínimo:
0.931
1 ene 1979 año
Máximo:
31.685
1 ene 2002 año
A la fecha de observación
Valor
Cambio absoluto
El cambio con respecto al valor anterior
1 ene 1976 año
1.617
+1.617
0.0%
1 ene 1977 año
1.554
-0.063
-3.92%
1 ene 1978 año
1.271
-0.283
-18.2%
1 ene 1979 año
0.931
-0.34
-26.76%
1 ene 1980 año
1.676
+0.745
80.02%
1 ene 1981 año
0.986
-0.69
-41.16%
1 ene 1982 año
0.992
+0.006
0.59%
1 ene 1983 año
0.954
-0.037
-3.78%
1 ene 1984 año
2.805
+1.85
193.92%
1 ene 1985 año
3.6
+0.796
28.37%
1 ene 1986 año
2.793
-0.807
-22.42%
1 ene 1987 año
11.78
+8.987
321.77%
1 ene 1988 año
3.257
-8.523
-72.35%
1 ene 1989 año
3.738
+0.48
14.75%
1 ene 1990 año
3.584
-0.153
-4.1%
1 ene 1991 año
4.205
+0.621
17.33%
1 ene 1992 año
5.618
+1.412
33.58%
1 ene 1993 año
4.84
-0.777
-13.84%
1 ene 1994 año
2.803
-2.037
-42.09%
1 ene 1995 año
2.8
-0.003
-0.1%
1 ene 1996 año
3.365
+0.565
20.18%
1 ene 1997 año
3.714
+0.349
10.36%
1 ene 1998 año
3.5
-0.214
-5.75%
1 ene 1999 año
3.804
+0.304
8.69%
1 ene 2000 año
3.933
+0.129
3.39%
1 ene 2001 año
4.433
+0.499
12.69%
1 ene 2002 año
31.685
+27.253
614.83%
1 ene 2003 año
3.626
-28.06
-88.56%
1 ene 2004 año
3.455
-0.17
-4.7%
1 ene 2005 año
3.341
-0.114
-3.3%
1 ene 2006 año
4.805
+1.463
43.79%
1 ene 2007 año
3.567
-1.238
-25.76%
1 ene 2008 año
3.146
-0.421
-11.8%
1 ene 2009 año
3.452
+0.306
9.74%
1 ene 2010 año
3.982
+0.53
15.35%
1 ene 2011 año
3.276
-0.706
-17.73%
1 ene 2012 año
2.961
-0.314
-9.6%
1 ene 2013 año
8.996
+6.035
203.79%
1 ene 2014 año
7.397
-1.599
-17.78%
1 ene 2015 año
6.654
-0.743
-10.04%
1 ene 2016 año
5.858
-0.796
-11.96%
Ranking de los países por los datos estadísticos actuales


Comentarios: