29
/es/
es
AIzaSyAYiBZKx7MnpbEhh9jyipgxe19OcubqV5w
April 1, 2024
201727
Morocco
MAR
true
2
1
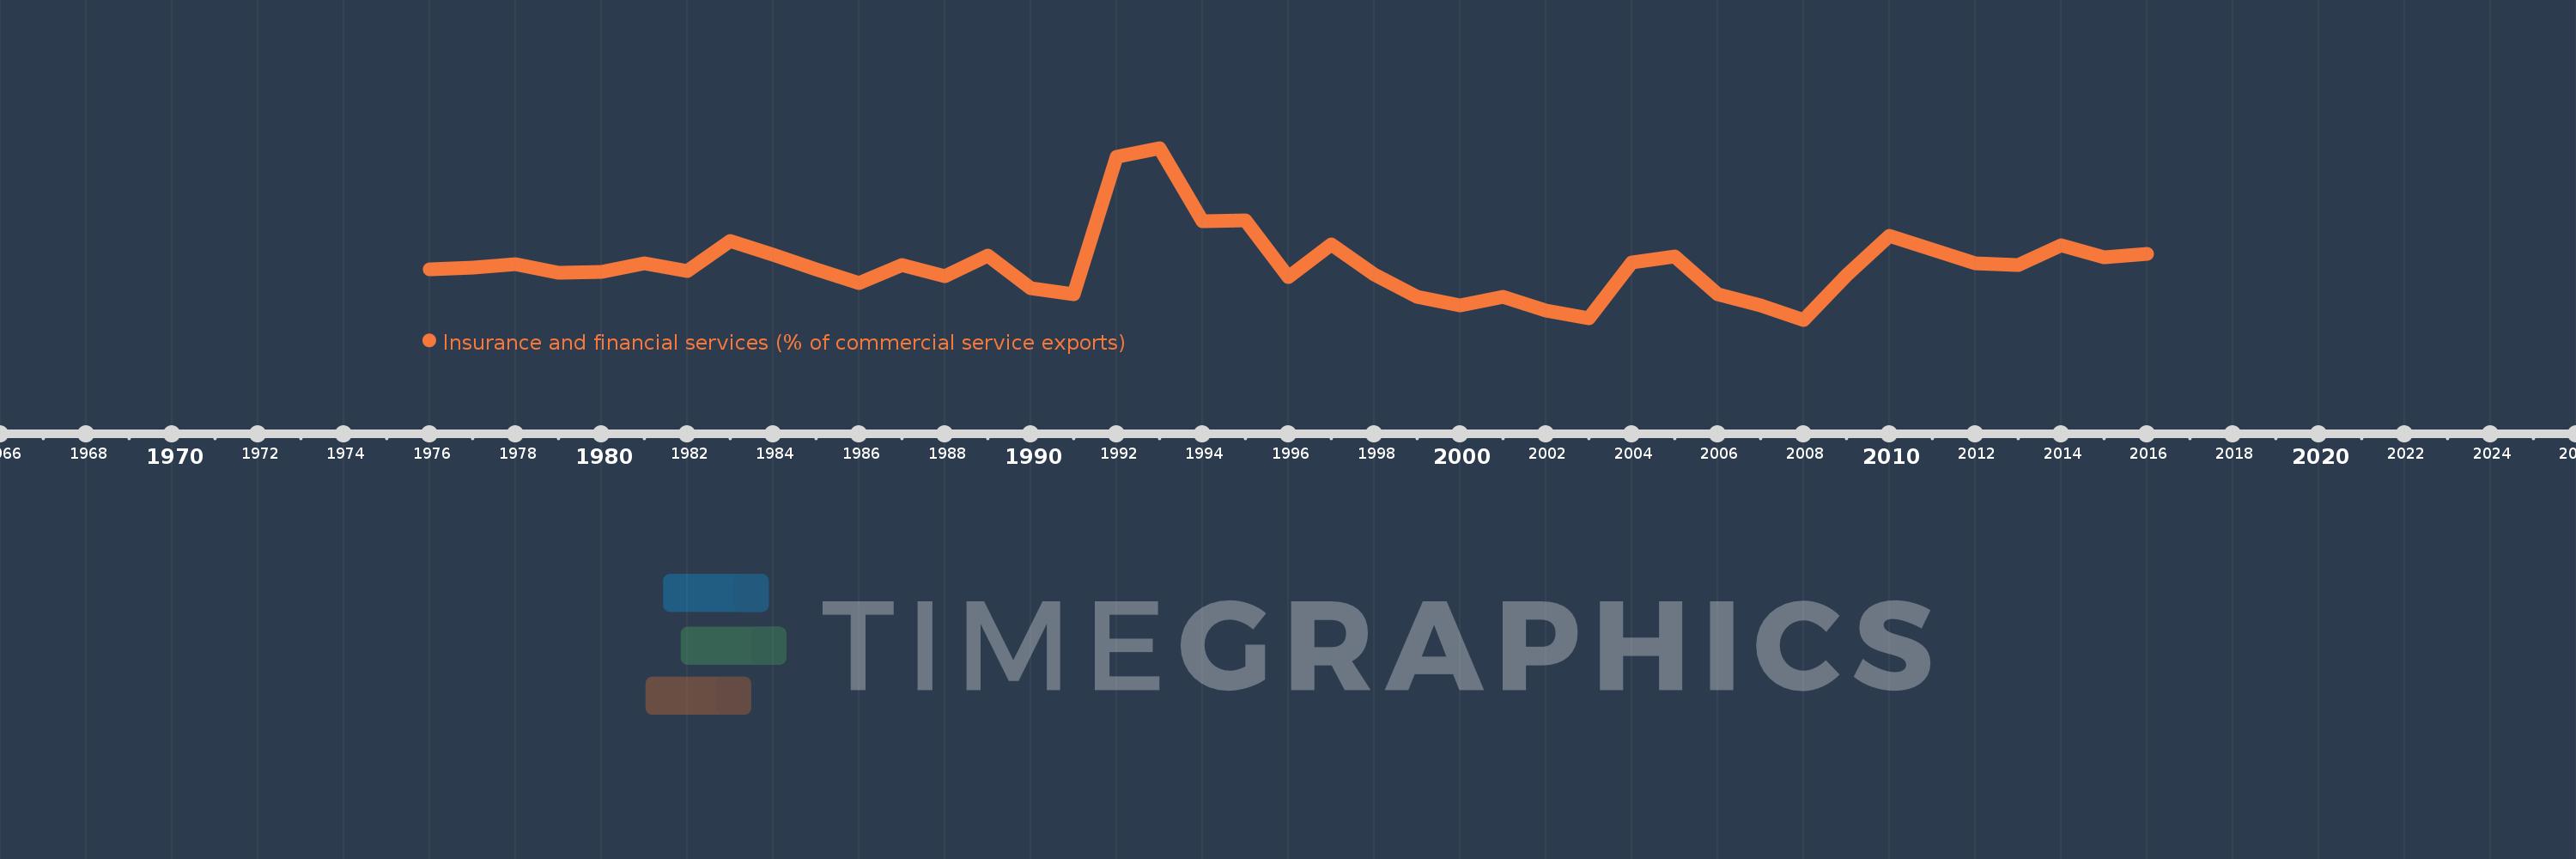
Insurance and financial services (% of commercial service exports)
2016,2015,2014,2013,2012,2011,2010,2009,2008,2007,2006,2005,2004,2003,2002,2001,2000,1999,1998,1997,1996,1995,1994,1993,1992,1991,1990,1989,1988,1987,1986,1985,1984,1983,1982,1981,1980,1979,1978,1977,1976
Estas estadísticas en otros países:
AfghanistanAlbaniaAlgeriaAngolaAntigua and BarbudaArab WorldArgentinaArmeniaArubaAustraliaAustriaAzerbaijanBahrainBangladeshBarbadosBelarusBelgiumBelizeBeninBermudaBhutanBoliviaBosnia and HerzegovinaBotswanaBrazilBrunei DarussalamBulgariaBurkina FasoBurundiCabo VerdeCambodiaCameroonCanadaCaribbean small statesCentral African RepublicCentral Europe and the BalticsChadChileChinaColombiaComorosCongo, Dem. Rep.Congo, Rep.Costa RicaCote d'IvoireCroatiaCuracaoCyprusCzech RepublicDenmarkDominicaDominican RepublicEarly-demographic dividendEast Asia & PacificEast Asia & Pacific (excluding high income)East Asia & Pacific (IDA & IBRD countries)EcuadorEgypt, Arab Rep.El SalvadorEritreaEstoniaEthiopiaEuro areaEurope & Central AsiaEurope & Central Asia (excluding high income)Europe & Central Asia (IDA & IBRD countries)European UnionFaroe IslandsFijiFinlandFragile and conflict affected situationsFranceFrench PolynesiaGabonGambia, TheGeorgiaGermanyGhanaGreeceGrenadaGuatemalaGuineaGuinea-BissauGuyanaHaitiHeavily indebted poor countries (HIPC)High incomeHondurasHong Kong SAR, ChinaHungaryIBRD onlyIcelandIDA & IBRD totalIDA onlyIDA totalIndiaIndonesiaIran, Islamic Rep.IraqIrelandIsraelItalyJamaicaJapanJordanKazakhstanKenyaKiribatiKorea, Rep.KosovoKuwaitKyrgyz RepublicLao PDRLate-demographic dividendLatin America & Caribbean Latin America & Caribbean (excluding high income)Latin America & the Caribbean (IDA & IBRD countries)LatviaLeast developed countries: UN classificationLebanonLesothoLiberiaLibyaLithuaniaLow & middle incomeLow incomeLower middle incomeLuxembourgMacao SAR, ChinaMacedonia, FYRMadagascarMalawiMalaysiaMaldivesMaliMaltaMauritaniaMauritiusMexicoMiddle East & North AfricaMiddle East & North Africa (excluding high income)Middle East & North Africa (IDA & IBRD countries)Middle incomeMoldovaMongoliaMontenegroMoroccoMozambiqueMyanmarNamibiaNepalNetherlandsNew CaledoniaNew ZealandNicaraguaNigerNigeriaNorth AmericaNorwayOECD membersOmanOther small statesPacific island small statesPakistanPalauPanamaPapua New GuineaParaguayPeruPhilippinesPolandPortugalPost-demographic dividendPre-demographic dividendQatarRomaniaRussian FederationRwandaSamoaSao Tome and PrincipeSaudi ArabiaSenegalSerbiaSeychellesSierra LeoneSingaporeSint Maarten (Dutch part)Slovak RepublicSloveniaSmall statesSolomon IslandsSouth AfricaSouth AsiaSouth Asia (IDA & IBRD)South SudanSpainSri LankaSt. Kitts and NevisSt. LuciaSt. Vincent and the GrenadinesSub-Saharan Africa Sub-Saharan Africa (excluding high income)Sub-Saharan Africa (IDA & IBRD countries)SudanSurinameSwazilandSwedenSwitzerlandSyrian Arab RepublicTajikistanTanzaniaThailandTimor-LesteTogoTongaTrinidad and TobagoTunisiaTurkeyTuvaluUgandaUkraineUnited KingdomUnited StatesUpper middle incomeUruguayVanuatuVenezuela, RBWest Bank and GazaWorldZambiaZimbabwe línea de tiempo (timeline):
En esta escala de tiempo se presenta un gráfico de 1976 y 2016 de Morocco. Los datos de 1975 están ausentes. El número de observaciones reales por fecha: 41.
Fuente (nombre):
Indicadores del desarrollo mundial
Fuente (organización):
International Monetary Fund, Balance of Payments Statistics Yearbook and data files.
Categorías:
Private Sector, Trade
Se ha actualizado:
23 abr 2017 año
Los indicadores de los cambios de valor en los últimos años
Mínimo:
0.536
1 ene 2008 año
Máximo:
2.465
1 ene 1993 año
A la fecha de observación
Valor
Cambio absoluto
El cambio con respecto al valor anterior
1 ene 1976 año
1.102
+1.102
0.0%
1 ene 1977 año
1.123
+0.021
1.95%
1 ene 1978 año
1.158
+0.034
3.07%
1 ene 1979 año
1.064
-0.094
-8.14%
1 ene 1980 año
1.072
+0.008
0.77%
1 ene 1981 año
1.173
+0.101
9.45%
1 ene 1982 año
1.082
-0.091
-7.75%
1 ene 1983 año
1.416
+0.334
30.87%
1 ene 1984 año
1.27
-0.147
-10.36%
1 ene 1985 año
1.103
-0.166
-13.11%
1 ene 1986 año
0.952
-0.151
-13.68%
1 ene 1987 año
1.146
+0.194
20.37%
1 ene 1988 año
1.022
-0.124
-10.85%
1 ene 1989 año
1.252
+0.23
22.54%
1 ene 1990 año
0.887
-0.365
-29.12%
1 ene 1991 año
0.824
-0.064
-7.19%
1 ene 1992 año
2.366
+1.542
187.21%
1 ene 1993 año
2.465
+0.099
4.2%
1 ene 1994 año
1.644
-0.821
-33.31%
1 ene 1995 año
1.649
+0.005
0.29%
1 ene 1996 año
1.015
-0.634
-38.46%
1 ene 1997 año
1.386
+0.371
36.56%
1 ene 1998 año
1.043
-0.342
-24.7%
1 ene 1999 año
0.794
-0.249
-23.89%
1 ene 2000 año
0.7
-0.094
-11.78%
1 ene 2001 año
0.79
+0.089
12.77%
1 ene 2002 año
0.638
-0.152
-19.26%
1 ene 2003 año
0.55
-0.088
-13.72%
1 ene 2004 año
1.182
+0.631
114.73%
1 ene 2005 año
1.245
+0.064
5.39%
1 ene 2006 año
0.823
-0.422
-33.91%
1 ene 2007 año
0.7
-0.123
-14.91%
1 ene 2008 año
0.536
-0.164
-23.44%
1 ene 2009 año
1.036
+0.499
93.14%
1 ene 2010 año
1.479
+0.443
42.76%
1 ene 2011 año
1.327
-0.152
-10.25%
1 ene 2012 año
1.172
-0.155
-11.7%
1 ene 2013 año
1.153
-0.018
-1.56%
1 ene 2014 año
1.369
+0.215
18.68%
1 ene 2015 año
1.238
-0.131
-9.57%
1 ene 2016 año
1.28
+0.042
3.43%
Ranking de los países por los datos estadísticos actuales


Comentarios: