29
/es/
es
AIzaSyAYiBZKx7MnpbEhh9jyipgxe19OcubqV5w
April 1, 2024
60529
Sub-Saharan Africa (IDA & IBRD countries)
TSS
false
2
1
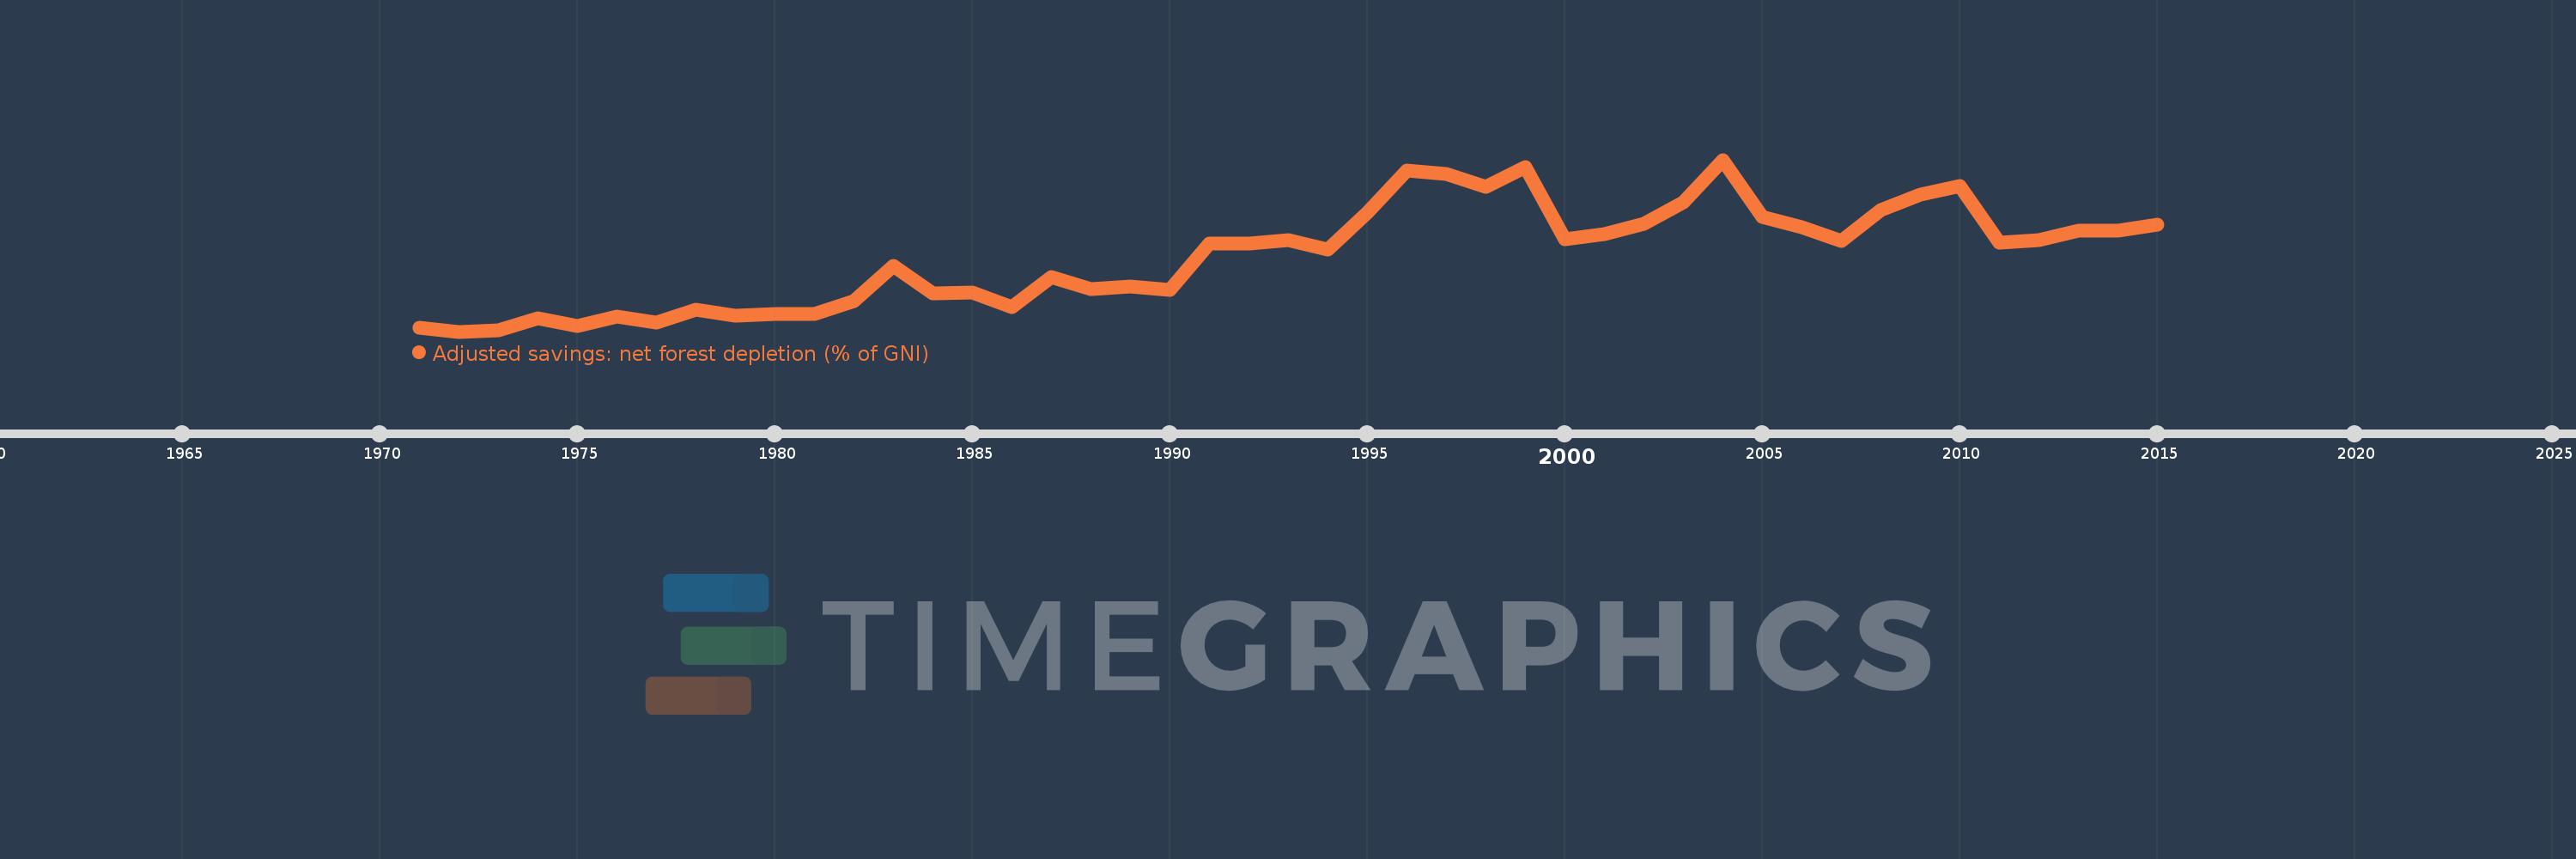
Adjusted savings: net forest depletion (% of GNI)
2015,2014,2013,2012,2011,2010,2009,2008,2007,2006,2005,2004,2003,2002,2001,2000,1999,1998,1997,1996,1995,1994,1993,1992,1991,1990,1989,1988,1987,1986,1985,1984,1983,1982,1981,1980,1979,1978,1977,1976,1975,1974,1973,1972,1971
Estas estadísticas en otros países:
AfghanistanAlbaniaAlgeriaAngolaArab WorldArgentinaArmeniaAustraliaAustriaAzerbaijanBahamas, TheBahrainBangladeshBarbadosBelarusBelgiumBelizeBeninBhutanBoliviaBotswanaBrazilBrunei DarussalamBulgariaBurkina FasoBurundiCabo VerdeCambodiaCameroonCanadaCaribbean small statesCentral African RepublicCentral Europe and the BalticsChadChileChinaColombiaComorosCongo, Dem. Rep.Congo, Rep.Costa RicaCote d'IvoireCroatiaCubaCyprusCzech RepublicDenmarkDjiboutiDominicaDominican RepublicEarly-demographic dividendEast Asia & PacificEast Asia & Pacific (excluding high income)East Asia & Pacific (IDA & IBRD countries)EcuadorEgypt, Arab Rep.El SalvadorEquatorial GuineaEritreaEstoniaEthiopiaEuro areaEurope & Central AsiaEurope & Central Asia (excluding high income)Europe & Central Asia (IDA & IBRD countries)European UnionFijiFinlandFragile and conflict affected situationsFranceFrench PolynesiaGabonGambia, TheGeorgiaGermanyGhanaGreeceGuatemalaGuineaGuinea-BissauGuyanaHaitiHeavily indebted poor countries (HIPC)High incomeHondurasHong Kong SAR, ChinaHungaryIBRD onlyIcelandIDA & IBRD totalIDA blendIDA onlyIDA totalIndiaIndonesiaIran, Islamic Rep.IraqIrelandIsraelItalyJamaicaJapanJordanKazakhstanKenyaKiribatiKorea, Rep.KuwaitKyrgyz RepublicLao PDRLate-demographic dividendLatin America & Caribbean Latin America & Caribbean (excluding high income)Latin America & the Caribbean (IDA & IBRD countries)LatviaLeast developed countries: UN classificationLebanonLesothoLiberiaLibyaLithuaniaLow & middle incomeLow incomeLower middle incomeLuxembourgMacedonia, FYRMadagascarMalawiMalaysiaMaldivesMaliMauritaniaMauritiusMexicoMicronesia, Fed. Sts.Middle East & North AfricaMiddle East & North Africa (excluding high income)Middle East & North Africa (IDA & IBRD countries)Middle incomeMoldovaMongoliaMoroccoMozambiqueMyanmarNamibiaNepalNetherlandsNew CaledoniaNew ZealandNicaraguaNigerNigeriaNorth AmericaNorwayOECD membersOmanOther small statesPacific island small statesPakistanPanamaPapua New GuineaParaguayPeruPhilippinesPolandPortugalPost-demographic dividendPre-demographic dividendQatarRomaniaRussian FederationRwandaSamoaSao Tome and PrincipeSaudi ArabiaSenegalSeychellesSierra LeoneSingaporeSlovak RepublicSloveniaSmall statesSolomon IslandsSomaliaSouth AfricaSouth AsiaSouth Asia (IDA & IBRD)SpainSri LankaSt. LuciaSt. Vincent and the GrenadinesSub-Saharan Africa Sub-Saharan Africa (excluding high income)Sub-Saharan Africa (IDA & IBRD countries)SudanSurinameSwazilandSwedenSwitzerlandSyrian Arab RepublicTajikistanTanzaniaThailandTogoTongaTrinidad and TobagoTunisiaTurkeyTurkmenistanUgandaUkraineUnited Arab EmiratesUnited KingdomUnited StatesUpper middle incomeUruguayUzbekistanVanuatuVenezuela, RBVietnamWorldYemen, Rep.ZambiaZimbabwe línea de tiempo (timeline):
En esta escala de tiempo se presenta un gráfico de 1971 y 2015 de Sub-Saharan Africa (IDA & IBRD countries). Los datos de 1970 están ausentes. El número de observaciones reales por fecha: 45.
Fuente (nombre):
Indicadores del desarrollo mundial
Fuente (organización):
World Bank staff estimates based on sources and methods in World Bank's "The Changing Wealth of Nations: Measuring Sustainable Development in the New Millennium" (2011).
Categorías:
Economy & Growth, Environment
Se ha actualizado:
23 abr 2017 año
Los indicadores de los cambios de valor en los últimos años
Mínimo:
0.372
1 ene 1972 año
Máximo:
2.767
1 ene 2004 año
A la fecha de observación
Valor
Cambio absoluto
El cambio con respecto al valor anterior
1 ene 1971 año
0.428
+0.428
0.0%
1 ene 1972 año
0.372
-0.056
-13.07%
1 ene 1973 año
0.391
+0.018
4.96%
1 ene 1974 año
0.558
+0.167
42.74%
1 ene 1975 año
0.448
-0.11
-19.73%
1 ene 1976 año
0.578
+0.131
29.19%
1 ene 1977 año
0.502
-0.076
-13.2%
1 ene 1978 año
0.677
+0.175
34.84%
1 ene 1979 año
0.593
-0.084
-12.37%
1 ene 1980 año
0.618
+0.025
4.15%
1 ene 1981 año
0.619
+0.002
0.26%
1 ene 1982 año
0.792
+0.173
27.94%
1 ene 1983 año
1.294
+0.502
63.39%
1 ene 1984 año
0.91
-0.384
-29.69%
1 ene 1985 año
0.912
+0.002
0.19%
1 ene 1986 año
0.709
-0.202
-22.19%
1 ene 1987 año
1.136
+0.427
60.16%
1 ene 1988 año
0.959
-0.177
-15.58%
1 ene 1989 año
0.999
+0.039
4.09%
1 ene 1990 año
0.956
-0.042
-4.24%
1 ene 1991 año
1.605
+0.649
67.87%
1 ene 1992 año
1.596
-0.009
-0.54%
1 ene 1993 año
1.647
+0.051
3.17%
1 ene 1994 año
1.518
-0.129
-7.83%
1 ene 1995 año
2.026
+0.508
33.44%
1 ene 1996 año
2.618
+0.592
29.24%
1 ene 1997 año
2.57
-0.048
-1.82%
1 ene 1998 año
2.394
-0.177
-6.87%
1 ene 1999 año
2.666
+0.272
11.35%
1 ene 2000 año
1.665
-1.0
-37.52%
1 ene 2001 año
1.735
+0.07
4.2%
1 ene 2002 año
1.871
+0.135
7.8%
1 ene 2003 año
2.174
+0.304
16.23%
1 ene 2004 año
2.767
+0.592
27.23%
1 ene 2005 año
1.973
-0.794
-28.7%
1 ene 2006 año
1.831
-0.141
-7.16%
1 ene 2007 año
1.64
-0.192
-10.47%
1 ene 2008 año
2.068
+0.428
26.12%
1 ene 2009 año
2.281
+0.214
10.33%
1 ene 2010 año
2.396
+0.115
5.02%
1 ene 2011 año
1.616
-0.78
-32.56%
1 ene 2012 año
1.646
+0.031
1.89%
1 ene 2013 año
1.775
+0.129
7.81%
1 ene 2014 año
1.781
+0.006
0.31%
1 ene 2015 año
1.865
+0.085
4.75%
Ranking de los países por los datos estadísticos actuales


Comentarios: