29
/es/
es
AIzaSyAYiBZKx7MnpbEhh9jyipgxe19OcubqV5w
April 1, 2024
50616
Middle income
MIC
false
2
1
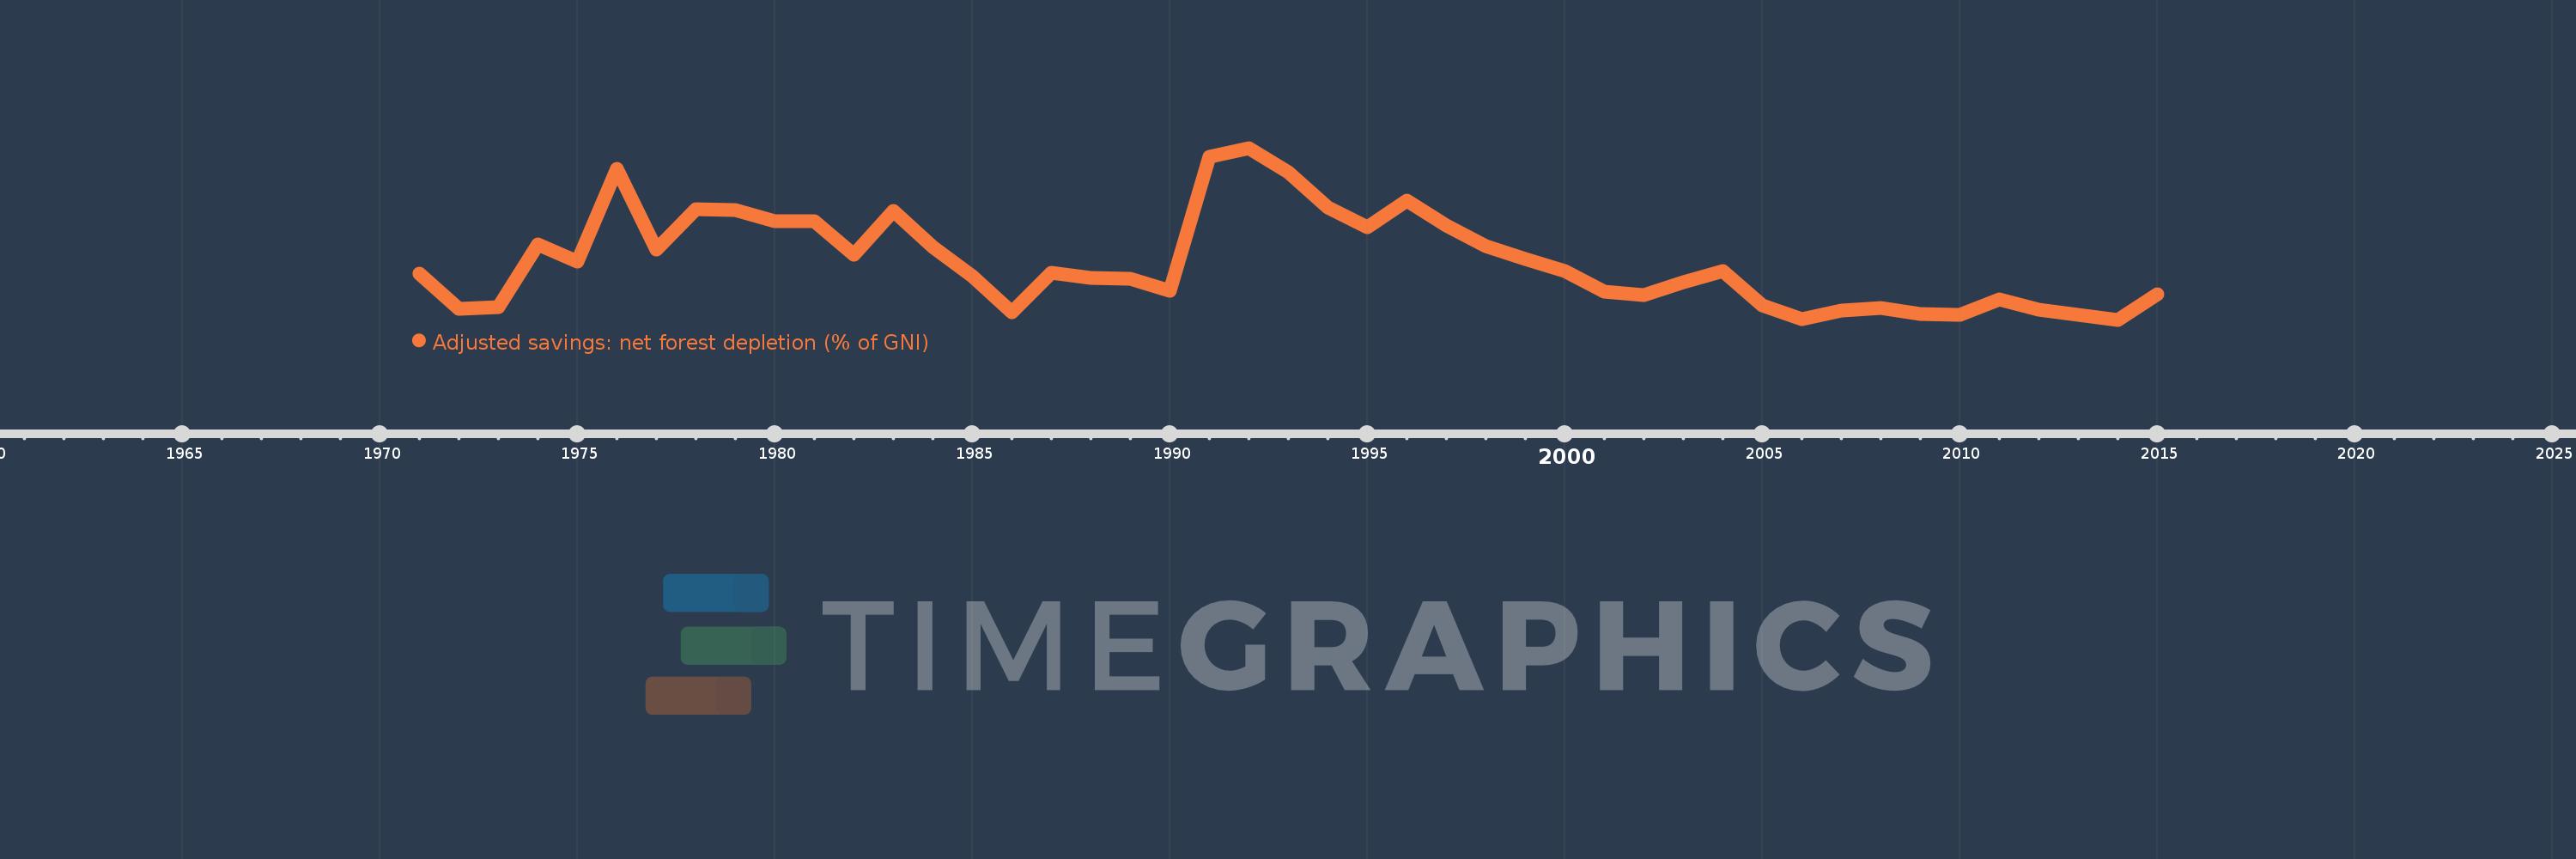
Adjusted savings: net forest depletion (% of GNI)
2015,2014,2013,2012,2011,2010,2009,2008,2007,2006,2005,2004,2003,2002,2001,2000,1999,1998,1997,1996,1995,1994,1993,1992,1991,1990,1989,1988,1987,1986,1985,1984,1983,1982,1981,1980,1979,1978,1977,1976,1975,1974,1973,1972,1971
Estas estadísticas en otros países:
AfghanistanAlbaniaAlgeriaAngolaArab WorldArgentinaArmeniaAustraliaAustriaAzerbaijanBahamas, TheBahrainBangladeshBarbadosBelarusBelgiumBelizeBeninBhutanBoliviaBotswanaBrazilBrunei DarussalamBulgariaBurkina FasoBurundiCabo VerdeCambodiaCameroonCanadaCaribbean small statesCentral African RepublicCentral Europe and the BalticsChadChileChinaColombiaComorosCongo, Dem. Rep.Congo, Rep.Costa RicaCote d'IvoireCroatiaCubaCyprusCzech RepublicDenmarkDjiboutiDominicaDominican RepublicEarly-demographic dividendEast Asia & PacificEast Asia & Pacific (excluding high income)East Asia & Pacific (IDA & IBRD countries)EcuadorEgypt, Arab Rep.El SalvadorEquatorial GuineaEritreaEstoniaEthiopiaEuro areaEurope & Central AsiaEurope & Central Asia (excluding high income)Europe & Central Asia (IDA & IBRD countries)European UnionFijiFinlandFragile and conflict affected situationsFranceFrench PolynesiaGabonGambia, TheGeorgiaGermanyGhanaGreeceGuatemalaGuineaGuinea-BissauGuyanaHaitiHeavily indebted poor countries (HIPC)High incomeHondurasHong Kong SAR, ChinaHungaryIBRD onlyIcelandIDA & IBRD totalIDA blendIDA onlyIDA totalIndiaIndonesiaIran, Islamic Rep.IraqIrelandIsraelItalyJamaicaJapanJordanKazakhstanKenyaKiribatiKorea, Rep.KuwaitKyrgyz RepublicLao PDRLate-demographic dividendLatin America & Caribbean Latin America & Caribbean (excluding high income)Latin America & the Caribbean (IDA & IBRD countries)LatviaLeast developed countries: UN classificationLebanonLesothoLiberiaLibyaLithuaniaLow & middle incomeLow incomeLower middle incomeLuxembourgMacedonia, FYRMadagascarMalawiMalaysiaMaldivesMaliMauritaniaMauritiusMexicoMicronesia, Fed. Sts.Middle East & North AfricaMiddle East & North Africa (excluding high income)Middle East & North Africa (IDA & IBRD countries)Middle incomeMoldovaMongoliaMoroccoMozambiqueMyanmarNamibiaNepalNetherlandsNew CaledoniaNew ZealandNicaraguaNigerNigeriaNorth AmericaNorwayOECD membersOmanOther small statesPacific island small statesPakistanPanamaPapua New GuineaParaguayPeruPhilippinesPolandPortugalPost-demographic dividendPre-demographic dividendQatarRomaniaRussian FederationRwandaSamoaSao Tome and PrincipeSaudi ArabiaSenegalSeychellesSierra LeoneSingaporeSlovak RepublicSloveniaSmall statesSolomon IslandsSomaliaSouth AfricaSouth AsiaSouth Asia (IDA & IBRD)SpainSri LankaSt. LuciaSt. Vincent and the GrenadinesSub-Saharan Africa Sub-Saharan Africa (excluding high income)Sub-Saharan Africa (IDA & IBRD countries)SudanSurinameSwazilandSwedenSwitzerlandSyrian Arab RepublicTajikistanTanzaniaThailandTogoTongaTrinidad and TobagoTunisiaTurkeyTurkmenistanUgandaUkraineUnited Arab EmiratesUnited KingdomUnited StatesUpper middle incomeUruguayUzbekistanVanuatuVenezuela, RBVietnamWorldYemen, Rep.ZambiaZimbabwe línea de tiempo (timeline):
En esta escala de tiempo se presenta un gráfico de 1971 y 2015 de Middle income. Los datos de 1970 están ausentes. El número de observaciones reales por fecha: 45.
Fuente (nombre):
Indicadores del desarrollo mundial
Fuente (organización):
World Bank staff estimates based on sources and methods in World Bank's "The Changing Wealth of Nations: Measuring Sustainable Development in the New Millennium" (2011).
Categorías:
Economy & Growth, Environment
Se ha actualizado:
23 abr 2017 año
Los indicadores de los cambios de valor en los últimos años
Mínimo:
0.243
1 ene 2014 año
Máximo:
0.803
1 ene 1992 año
A la fecha de observación
Valor
Cambio absoluto
El cambio con respecto al valor anterior
1 ene 1971 año
0.393
+0.393
0.0%
1 ene 1972 año
0.279
-0.114
-29.11%
1 ene 1973 año
0.283
+0.005
1.67%
1 ene 1974 año
0.489
+0.206
72.68%
1 ene 1975 año
0.432
-0.057
-11.62%
1 ene 1976 año
0.735
+0.303
70.14%
1 ene 1977 año
0.471
-0.264
-35.88%
1 ene 1978 año
0.604
+0.133
28.19%
1 ene 1979 año
0.6
-0.004
-0.67%
1 ene 1980 año
0.563
-0.037
-6.24%
1 ene 1981 año
0.565
+0.002
0.29%
1 ene 1982 año
0.455
-0.11
-19.42%
1 ene 1983 año
0.597
+0.142
31.28%
1 ene 1984 año
0.481
-0.117
-19.54%
1 ene 1985 año
0.385
-0.096
-19.9%
1 ene 1986 año
0.268
-0.117
-30.41%
1 ene 1987 año
0.395
+0.127
47.33%
1 ene 1988 año
0.38
-0.015
-3.77%
1 ene 1989 año
0.376
-0.004
-1.0%
1 ene 1990 año
0.336
-0.04
-10.54%
1 ene 1991 año
0.775
+0.438
130.34%
1 ene 1992 año
0.803
+0.028
3.64%
1 ene 1993 año
0.724
-0.079
-9.8%
1 ene 1994 año
0.609
-0.115
-15.94%
1 ene 1995 año
0.545
-0.064
-10.45%
1 ene 1996 año
0.632
+0.087
15.89%
1 ene 1997 año
0.55
-0.082
-13.01%
1 ene 1998 año
0.483
-0.066
-12.1%
1 ene 1999 año
0.44
-0.043
-8.88%
1 ene 2000 año
0.401
-0.039
-8.97%
1 ene 2001 año
0.335
-0.066
-16.35%
1 ene 2002 año
0.322
-0.013
-3.82%
1 ene 2003 año
0.365
+0.043
13.26%
1 ene 2004 año
0.403
+0.038
10.38%
1 ene 2005 año
0.289
-0.114
-28.36%
1 ene 2006 año
0.245
-0.044
-15.27%
1 ene 2007 año
0.274
+0.029
11.96%
1 ene 2008 año
0.281
+0.007
2.5%
1 ene 2009 año
0.261
-0.02
-7.14%
1 ene 2010 año
0.259
-0.002
-0.77%
1 ene 2011 año
0.31
+0.051
19.76%
1 ene 2012 año
0.277
-0.032
-10.45%
1 ene 2013 año
0.259
-0.018
-6.54%
1 ene 2014 año
0.243
-0.017
-6.37%
1 ene 2015 año
0.325
+0.083
34.01%
Ranking de los países por los datos estadísticos actuales


Comentarios: