29
/es/
es
AIzaSyAYiBZKx7MnpbEhh9jyipgxe19OcubqV5w
April 1, 2024
34014
Fragile and conflict affected situations
FCS
false
2
1
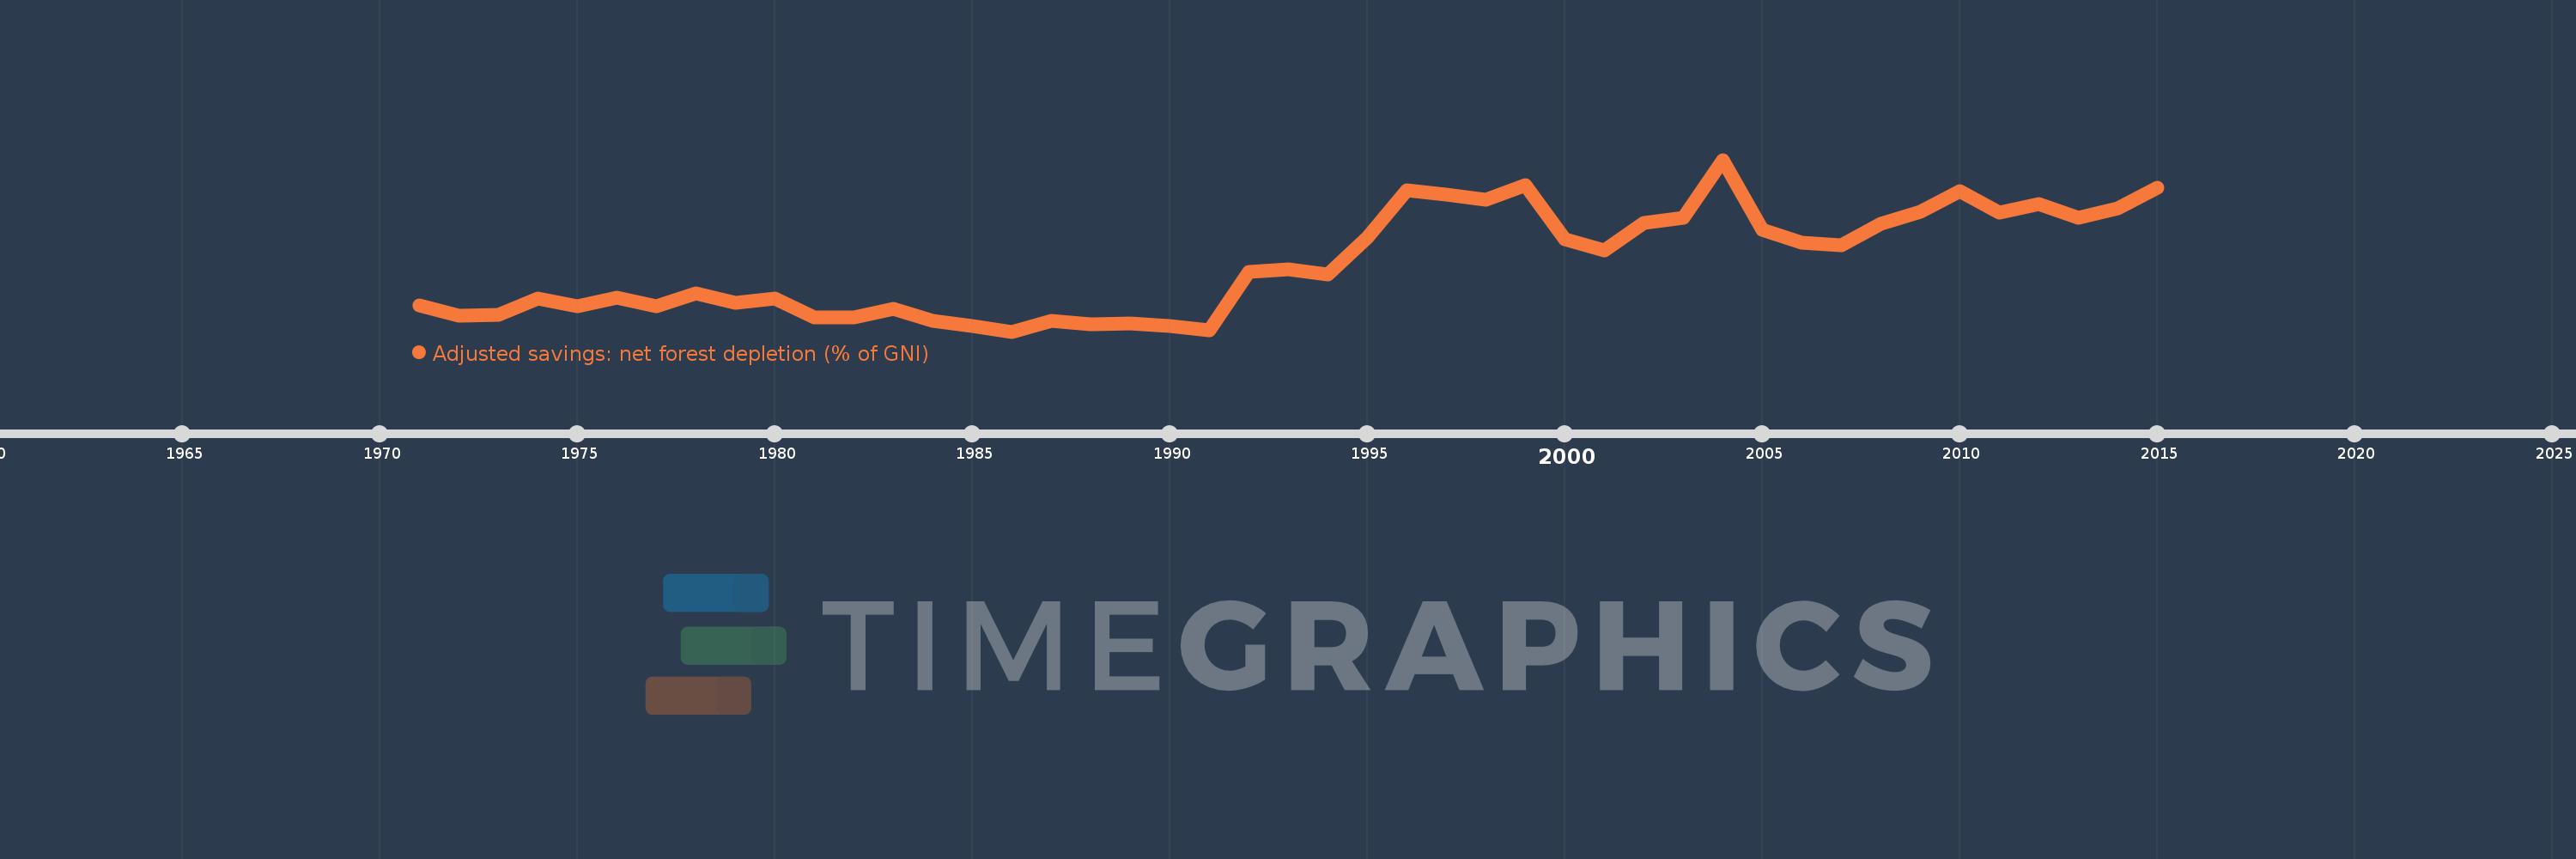
Adjusted savings: net forest depletion (% of GNI)
2015,2014,2013,2012,2011,2010,2009,2008,2007,2006,2005,2004,2003,2002,2001,2000,1999,1998,1997,1996,1995,1994,1993,1992,1991,1990,1989,1988,1987,1986,1985,1984,1983,1982,1981,1980,1979,1978,1977,1976,1975,1974,1973,1972,1971
Estas estadísticas en otros países:
AfghanistanAlbaniaAlgeriaAngolaArab WorldArgentinaArmeniaAustraliaAustriaAzerbaijanBahamas, TheBahrainBangladeshBarbadosBelarusBelgiumBelizeBeninBhutanBoliviaBotswanaBrazilBrunei DarussalamBulgariaBurkina FasoBurundiCabo VerdeCambodiaCameroonCanadaCaribbean small statesCentral African RepublicCentral Europe and the BalticsChadChileChinaColombiaComorosCongo, Dem. Rep.Congo, Rep.Costa RicaCote d'IvoireCroatiaCubaCyprusCzech RepublicDenmarkDjiboutiDominicaDominican RepublicEarly-demographic dividendEast Asia & PacificEast Asia & Pacific (excluding high income)East Asia & Pacific (IDA & IBRD countries)EcuadorEgypt, Arab Rep.El SalvadorEquatorial GuineaEritreaEstoniaEthiopiaEuro areaEurope & Central AsiaEurope & Central Asia (excluding high income)Europe & Central Asia (IDA & IBRD countries)European UnionFijiFinlandFragile and conflict affected situationsFranceFrench PolynesiaGabonGambia, TheGeorgiaGermanyGhanaGreeceGuatemalaGuineaGuinea-BissauGuyanaHaitiHeavily indebted poor countries (HIPC)High incomeHondurasHong Kong SAR, ChinaHungaryIBRD onlyIcelandIDA & IBRD totalIDA blendIDA onlyIDA totalIndiaIndonesiaIran, Islamic Rep.IraqIrelandIsraelItalyJamaicaJapanJordanKazakhstanKenyaKiribatiKorea, Rep.KuwaitKyrgyz RepublicLao PDRLate-demographic dividendLatin America & Caribbean Latin America & Caribbean (excluding high income)Latin America & the Caribbean (IDA & IBRD countries)LatviaLeast developed countries: UN classificationLebanonLesothoLiberiaLibyaLithuaniaLow & middle incomeLow incomeLower middle incomeLuxembourgMacedonia, FYRMadagascarMalawiMalaysiaMaldivesMaliMauritaniaMauritiusMexicoMicronesia, Fed. Sts.Middle East & North AfricaMiddle East & North Africa (excluding high income)Middle East & North Africa (IDA & IBRD countries)Middle incomeMoldovaMongoliaMoroccoMozambiqueMyanmarNamibiaNepalNetherlandsNew CaledoniaNew ZealandNicaraguaNigerNigeriaNorth AmericaNorwayOECD membersOmanOther small statesPacific island small statesPakistanPanamaPapua New GuineaParaguayPeruPhilippinesPolandPortugalPost-demographic dividendPre-demographic dividendQatarRomaniaRussian FederationRwandaSamoaSao Tome and PrincipeSaudi ArabiaSenegalSeychellesSierra LeoneSingaporeSlovak RepublicSloveniaSmall statesSolomon IslandsSomaliaSouth AfricaSouth AsiaSouth Asia (IDA & IBRD)SpainSri LankaSt. LuciaSt. Vincent and the GrenadinesSub-Saharan Africa Sub-Saharan Africa (excluding high income)Sub-Saharan Africa (IDA & IBRD countries)SudanSurinameSwazilandSwedenSwitzerlandSyrian Arab RepublicTajikistanTanzaniaThailandTogoTongaTrinidad and TobagoTunisiaTurkeyTurkmenistanUgandaUkraineUnited Arab EmiratesUnited KingdomUnited StatesUpper middle incomeUruguayUzbekistanVanuatuVenezuela, RBVietnamWorldYemen, Rep.ZambiaZimbabwe línea de tiempo (timeline):
En esta escala de tiempo se presenta un gráfico de 1971 y 2015 de Fragile and conflict affected situations. Los datos de 1970 están ausentes. El número de observaciones reales por fecha: 45.
Fuente (nombre):
Indicadores del desarrollo mundial
Fuente (organización):
World Bank staff estimates based on sources and methods in World Bank's "The Changing Wealth of Nations: Measuring Sustainable Development in the New Millennium" (2011).
Categorías:
Economy & Growth, Environment
Se ha actualizado:
23 abr 2017 año
Los indicadores de los cambios de valor en los últimos años
Mínimo:
0.17
1 ene 1986 año
Máximo:
1.86
1 ene 2004 año
A la fecha de observación
Valor
Cambio absoluto
El cambio con respecto al valor anterior
1 ene 1971 año
0.425
+0.425
0.0%
1 ene 1972 año
0.323
-0.103
-24.15%
1 ene 1973 año
0.332
+0.009
2.76%
1 ene 1974 año
0.499
+0.168
50.53%
1 ene 1975 año
0.417
-0.082
-16.42%
1 ene 1976 año
0.501
+0.084
20.19%
1 ene 1977 año
0.416
-0.086
-17.06%
1 ene 1978 año
0.544
+0.128
30.86%
1 ene 1979 año
0.449
-0.095
-17.44%
1 ene 1980 año
0.495
+0.046
10.17%
1 ene 1981 año
0.308
-0.187
-37.8%
1 ene 1982 año
0.307
-0.001
-0.35%
1 ene 1983 año
0.39
+0.083
27.17%
1 ene 1984 año
0.273
-0.117
-29.92%
1 ene 1985 año
0.226
-0.047
-17.26%
1 ene 1986 año
0.17
-0.056
-24.8%
1 ene 1987 año
0.277
+0.107
62.93%
1 ene 1988 año
0.244
-0.033
-12.07%
1 ene 1989 año
0.247
+0.003
1.42%
1 ene 1990 año
0.227
-0.02
-8.23%
1 ene 1991 año
0.186
-0.041
-17.93%
1 ene 1992 año
0.759
+0.573
307.69%
1 ene 1993 año
0.78
+0.021
2.74%
1 ene 1994 año
0.736
-0.044
-5.6%
1 ene 1995 año
1.096
+0.36
48.95%
1 ene 1996 año
1.559
+0.463
42.2%
1 ene 1997 año
1.514
-0.045
-2.9%
1 ene 1998 año
1.463
-0.051
-3.35%
1 ene 1999 año
1.614
+0.151
10.35%
1 ene 2000 año
1.078
-0.536
-33.23%
1 ene 2001 año
0.965
-0.113
-10.51%
1 ene 2002 año
1.235
+0.27
28.0%
1 ene 2003 año
1.286
+0.052
4.18%
1 ene 2004 año
1.86
+0.573
44.58%
1 ene 2005 año
1.175
-0.685
-36.82%
1 ene 2006 año
1.043
-0.132
-11.24%
1 ene 2007 año
1.02
-0.023
-2.19%
1 ene 2008 año
1.234
+0.214
20.99%
1 ene 2009 año
1.345
+0.111
8.99%
1 ene 2010 año
1.553
+0.208
15.48%
1 ene 2011 año
1.343
-0.21
-13.54%
1 ene 2012 año
1.422
+0.079
5.87%
1 ene 2013 año
1.291
-0.131
-9.22%
1 ene 2014 año
1.386
+0.095
7.34%
1 ene 2015 año
1.587
+0.202
14.57%
Ranking de los países por los datos estadísticos actuales


Comentarios: