29
/es/
es
AIzaSyAYiBZKx7MnpbEhh9jyipgxe19OcubqV5w
April 1, 2024
187421
Malaysia
MYS
true
2
1
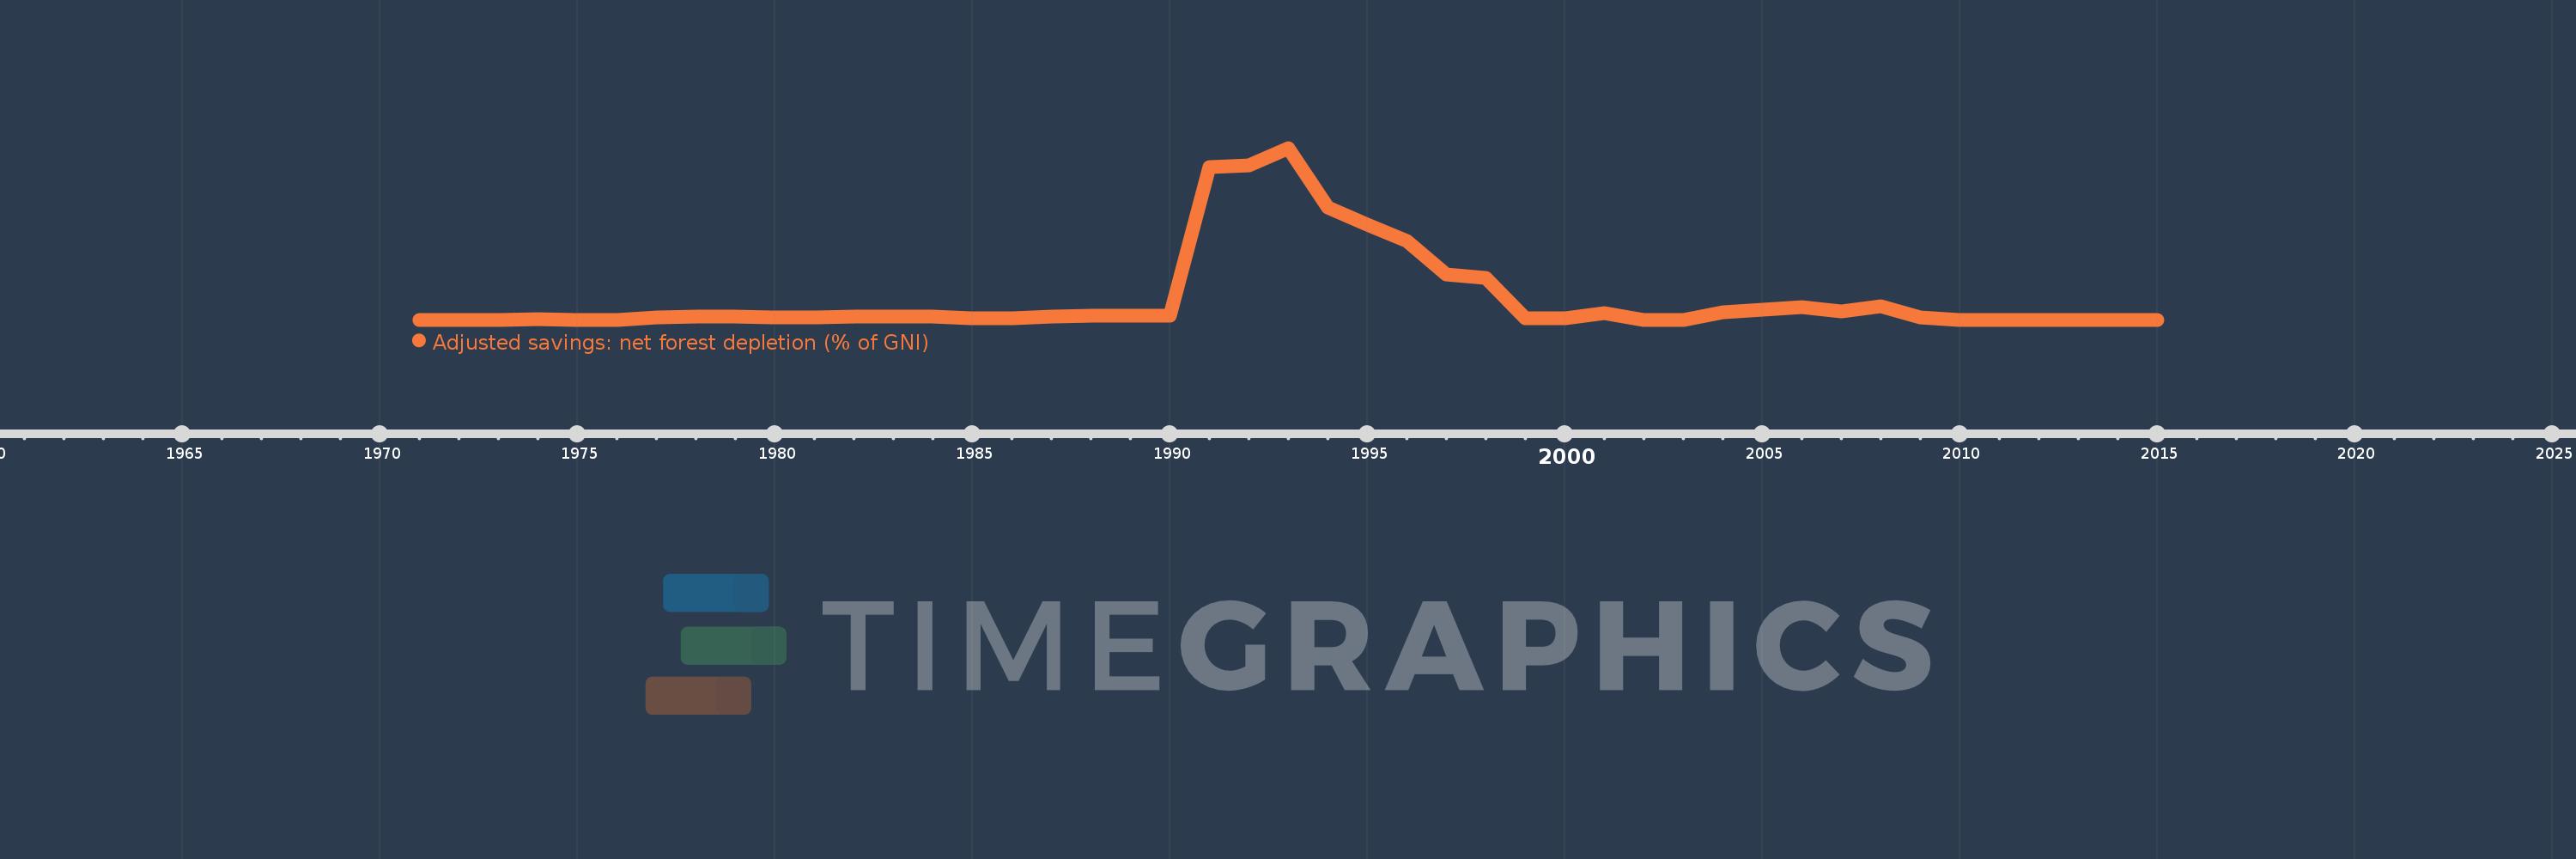
Adjusted savings: net forest depletion (% of GNI)
2015,2014,2013,2012,2011,2010,2009,2008,2007,2006,2005,2004,2003,2002,2001,2000,1999,1998,1997,1996,1995,1994,1993,1992,1991,1990,1989,1988,1987,1986,1985,1984,1983,1982,1981,1980,1979,1978,1977,1976,1975,1974,1973,1972,1971
Estas estadísticas en otros países:
AfghanistanAlbaniaAlgeriaAngolaArab WorldArgentinaArmeniaAustraliaAustriaAzerbaijanBahamas, TheBahrainBangladeshBarbadosBelarusBelgiumBelizeBeninBhutanBoliviaBotswanaBrazilBrunei DarussalamBulgariaBurkina FasoBurundiCabo VerdeCambodiaCameroonCanadaCaribbean small statesCentral African RepublicCentral Europe and the BalticsChadChileChinaColombiaComorosCongo, Dem. Rep.Congo, Rep.Costa RicaCote d'IvoireCroatiaCubaCyprusCzech RepublicDenmarkDjiboutiDominicaDominican RepublicEarly-demographic dividendEast Asia & PacificEast Asia & Pacific (excluding high income)East Asia & Pacific (IDA & IBRD countries)EcuadorEgypt, Arab Rep.El SalvadorEquatorial GuineaEritreaEstoniaEthiopiaEuro areaEurope & Central AsiaEurope & Central Asia (excluding high income)Europe & Central Asia (IDA & IBRD countries)European UnionFijiFinlandFragile and conflict affected situationsFranceFrench PolynesiaGabonGambia, TheGeorgiaGermanyGhanaGreeceGuatemalaGuineaGuinea-BissauGuyanaHaitiHeavily indebted poor countries (HIPC)High incomeHondurasHong Kong SAR, ChinaHungaryIBRD onlyIcelandIDA & IBRD totalIDA blendIDA onlyIDA totalIndiaIndonesiaIran, Islamic Rep.IraqIrelandIsraelItalyJamaicaJapanJordanKazakhstanKenyaKiribatiKorea, Rep.KuwaitKyrgyz RepublicLao PDRLate-demographic dividendLatin America & Caribbean Latin America & Caribbean (excluding high income)Latin America & the Caribbean (IDA & IBRD countries)LatviaLeast developed countries: UN classificationLebanonLesothoLiberiaLibyaLithuaniaLow & middle incomeLow incomeLower middle incomeLuxembourgMacedonia, FYRMadagascarMalawiMalaysiaMaldivesMaliMauritaniaMauritiusMexicoMicronesia, Fed. Sts.Middle East & North AfricaMiddle East & North Africa (excluding high income)Middle East & North Africa (IDA & IBRD countries)Middle incomeMoldovaMongoliaMoroccoMozambiqueMyanmarNamibiaNepalNetherlandsNew CaledoniaNew ZealandNicaraguaNigerNigeriaNorth AmericaNorwayOECD membersOmanOther small statesPacific island small statesPakistanPanamaPapua New GuineaParaguayPeruPhilippinesPolandPortugalPost-demographic dividendPre-demographic dividendQatarRomaniaRussian FederationRwandaSamoaSao Tome and PrincipeSaudi ArabiaSenegalSeychellesSierra LeoneSingaporeSlovak RepublicSloveniaSmall statesSolomon IslandsSomaliaSouth AfricaSouth AsiaSouth Asia (IDA & IBRD)SpainSri LankaSt. LuciaSt. Vincent and the GrenadinesSub-Saharan Africa Sub-Saharan Africa (excluding high income)Sub-Saharan Africa (IDA & IBRD countries)SudanSurinameSwazilandSwedenSwitzerlandSyrian Arab RepublicTajikistanTanzaniaThailandTogoTongaTrinidad and TobagoTunisiaTurkeyTurkmenistanUgandaUkraineUnited Arab EmiratesUnited KingdomUnited StatesUpper middle incomeUruguayUzbekistanVanuatuVenezuela, RBVietnamWorldYemen, Rep.ZambiaZimbabwe línea de tiempo (timeline):
En esta escala de tiempo se presenta un gráfico de 1971 y 2015 de Malaysia. Los datos de 1970 están ausentes. El número de observaciones reales por fecha: 45.
Fuente (nombre):
Indicadores del desarrollo mundial
Fuente (organización):
World Bank staff estimates based on sources and methods in World Bank's "The Changing Wealth of Nations: Measuring Sustainable Development in the New Millennium" (2011).
Categorías:
Economy & Growth, Environment
Se ha actualizado:
23 abr 2017 año
Los indicadores de los cambios de valor en los últimos años
Máximo:
2.263
1 ene 1993 año
A la fecha de observación
Valor
Cambio absoluto
El cambio con respecto al valor anterior
1 ene 1971 año
0.0
0.0
0.0%
1 ene 1974 año
0.003
+0.003
%
1 ene 1975 año
0.0
-0.003
-100.0%
1 ene 1977 año
0.026
+0.026
%
1 ene 1978 año
0.037
+0.01
38.45%
1 ene 1979 año
0.045
+0.009
23.58%
1 ene 1980 año
0.036
-0.009
-19.98%
1 ene 1981 año
0.029
-0.007
-19.71%
1 ene 1982 año
0.042
+0.013
45.93%
1 ene 1983 año
0.042
-0.001
-1.76%
1 ene 1984 año
0.037
-0.004
-10.18%
1 ene 1985 año
0.022
-0.016
-41.67%
1 ene 1986 año
0.018
-0.004
-17.05%
1 ene 1987 año
0.039
+0.021
115.62%
1 ene 1988 año
0.051
+0.012
29.56%
1 ene 1989 año
0.054
+0.004
7.41%
1 ene 1990 año
0.052
-0.002
-3.43%
1 ene 1991 año
2.014
+1.961
3.74 mil%
1 ene 1992 año
2.038
+0.025
1.22%
1 ene 1993 año
2.263
+0.225
11.05%
1 ene 1994 año
1.479
-0.784
-34.66%
1 ene 1995 año
1.247
-0.232
-15.71%
1 ene 1996 año
1.038
-0.209
-16.76%
1 ene 1997 año
0.597
-0.441
-42.51%
1 ene 1998 año
0.555
-0.041
-6.94%
1 ene 1999 año
0.014
-0.541
-97.46%
1 ene 2000 año
0.02
+0.006
40.78%
1 ene 2001 año
0.087
+0.067
339.54%
1 ene 2002 año
0.0
-0.087
-100.0%
1 ene 2004 año
0.096
+0.096
%
1 ene 2005 año
0.129
+0.033
34.24%
1 ene 2006 año
0.161
+0.032
25.03%
1 ene 2007 año
0.111
-0.05
-30.92%
1 ene 2008 año
0.183
+0.072
64.34%
1 ene 2009 año
0.029
-0.154
-84.31%
1 ene 2010 año
0.0
-0.029
-100.0%
Ranking de los países por los datos estadísticos actuales


Comentarios: