29
/es/
es
AIzaSyAYiBZKx7MnpbEhh9jyipgxe19OcubqV5w
April 1, 2024
59609
Sub-Saharan Africa (excluding high income)
SSA
false
2
1
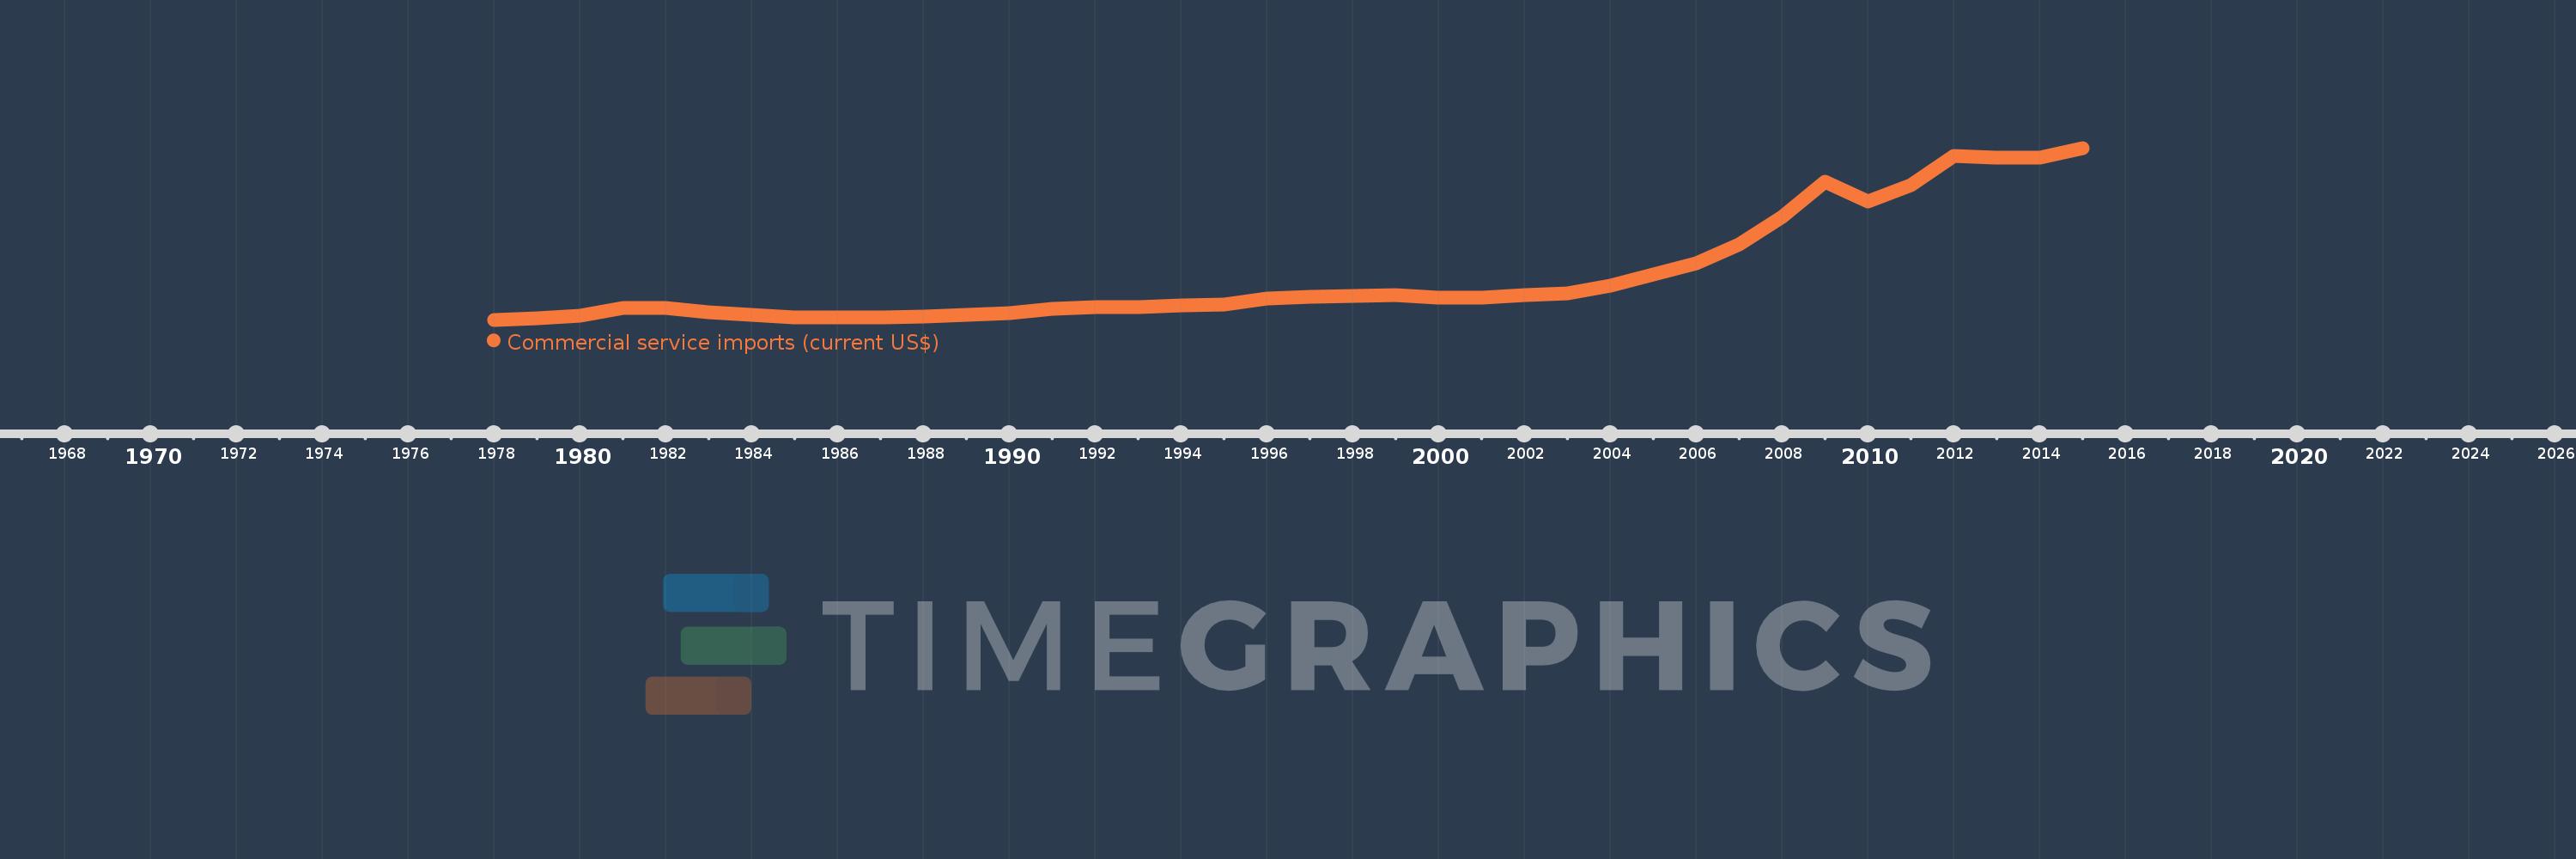
Commercial service imports (current US$)
2015,2014,2013,2012,2011,2010,2009,2008,2007,2006,2005,2004,2003,2002,2001,2000,1999,1998,1997,1996,1995,1994,1993,1992,1991,1990,1989,1988,1987,1986,1985,1984,1983,1982,1981,1980,1979,1978
Estas estadísticas en otros países:
AfghanistanAlbaniaAlgeriaAngolaAntigua and BarbudaArab WorldArgentinaArmeniaArubaAustraliaAustriaAzerbaijanBahamas, TheBahrainBangladeshBarbadosBelarusBelgiumBelizeBeninBermudaBhutanBoliviaBosnia and HerzegovinaBotswanaBrazilBrunei DarussalamBulgariaBurkina FasoBurundiCabo VerdeCambodiaCameroonCanadaCaribbean small statesCentral African RepublicCentral Europe and the BalticsChadChileChinaColombiaComorosCongo, Dem. Rep.Congo, Rep.Costa RicaCote d'IvoireCroatiaCuracaoCyprusCzech RepublicDenmarkDjiboutiDominicaDominican RepublicEarly-demographic dividendEast Asia & PacificEast Asia & Pacific (excluding high income)East Asia & Pacific (IDA & IBRD countries)EcuadorEgypt, Arab Rep.El SalvadorEquatorial GuineaEritreaEstoniaEthiopiaEuro areaEurope & Central AsiaEurope & Central Asia (excluding high income)Europe & Central Asia (IDA & IBRD countries)European UnionFaroe IslandsFijiFinlandFragile and conflict affected situationsFranceFrench PolynesiaGabonGambia, TheGeorgiaGermanyGhanaGreeceGrenadaGuatemalaGuineaGuinea-BissauGuyanaHaitiHeavily indebted poor countries (HIPC)High incomeHondurasHong Kong SAR, ChinaHungaryIBRD onlyIcelandIDA & IBRD totalIDA blendIDA onlyIDA totalIndiaIndonesiaIran, Islamic Rep.IraqIrelandIsraelItalyJamaicaJapanJordanKazakhstanKenyaKiribatiKorea, Rep.KosovoKuwaitKyrgyz RepublicLao PDRLate-demographic dividendLatin America & Caribbean Latin America & Caribbean (excluding high income)Latin America & the Caribbean (IDA & IBRD countries)LatviaLeast developed countries: UN classificationLebanonLesothoLiberiaLibyaLithuaniaLow & middle incomeLow incomeLower middle incomeLuxembourgMacao SAR, ChinaMacedonia, FYRMadagascarMalawiMalaysiaMaldivesMaliMaltaMarshall IslandsMauritaniaMauritiusMexicoMicronesia, Fed. Sts.Middle East & North Africa (excluding high income)Middle East & North Africa (IDA & IBRD countries)Middle incomeMoldovaMongoliaMontenegroMoroccoMozambiqueMyanmarNamibiaNepalNetherlandsNew CaledoniaNew ZealandNicaraguaNigerNigeriaNorth AmericaNorwayOECD membersOmanOther small statesPacific island small statesPakistanPalauPanamaPapua New GuineaParaguayPeruPhilippinesPolandPortugalPost-demographic dividendPre-demographic dividendQatarRomaniaRussian FederationRwandaSamoaSao Tome and PrincipeSaudi ArabiaSenegalSerbiaSeychellesSierra LeoneSingaporeSint Maarten (Dutch part)Slovak RepublicSloveniaSmall statesSolomon IslandsSouth AfricaSouth AsiaSouth Asia (IDA & IBRD)South SudanSpainSri LankaSt. Kitts and NevisSt. LuciaSt. Vincent and the GrenadinesSub-Saharan Africa Sub-Saharan Africa (excluding high income)Sub-Saharan Africa (IDA & IBRD countries)SudanSurinameSwazilandSwedenSwitzerlandSyrian Arab RepublicTajikistanTanzaniaThailandTimor-LesteTogoTongaTrinidad and TobagoTunisiaTurkeyTuvaluUgandaUkraineUnited KingdomUnited StatesUpper middle incomeUruguayVanuatuVenezuela, RBVietnamWest Bank and GazaWorldYemen, Rep.ZambiaZimbabwe línea de tiempo (timeline):
En esta escala de tiempo se presenta un gráfico de 1978 y 2015 de Sub-Saharan Africa (excluding high income). Los datos de 1977 están ausentes. El número de observaciones reales por fecha: 38.
Fuente (nombre):
Indicadores del desarrollo mundial
Fuente (organización):
International Monetary Fund, Balance of Payments Statistics Yearbook and data files.
Categorías:
Private Sector, Trade
Se ha actualizado:
23 abr 2017 año
Los indicadores de los cambios de valor en los últimos años
Mínimo:
10.171 bn
1 ene 1978 año
Máximo:
121.624 bn
1 ene 2015 año
A la fecha de observación
Valor
Cambio absoluto
El cambio con respecto al valor anterior
1 ene 1978 año
10.171 bn
+10.171 bn
0.0%
1 ene 1979 año
11.199 bn
+1.028 bn
10.1%
1 ene 1980 año
12.753 bn
+1.554 bn
13.87%
1 ene 1981 año
17.686 bn
+4.934 bn
38.69%
1 ene 1982 año
17.819 bn
+132.261 millones
0.75%
1 ene 1983 año
14.896 bn
-2.923 bn
-16.4%
1 ene 1984 año
13.315 bn
-1.581 bn
-10.61%
1 ene 1985 año
11.648 bn
-1.667 bn
-12.52%
1 ene 1986 año
11.782 bn
+134.606 millones
1.16%
1 ene 1987 año
11.564 bn
-218.488 millones
-1.85%
1 ene 1988 año
12.173 bn
+608.609 millones
5.26%
1 ene 1989 año
13.452 bn
+1.279 bn
10.51%
1 ene 1990 año
14.605 bn
+1.153 bn
8.57%
1 ene 1991 año
17.011 bn
+2.406 bn
16.47%
1 ene 1992 año
18.238 bn
+1.227 bn
7.21%
1 ene 1993 año
18.437 bn
+198.899 millones
1.09%
1 ene 1994 año
19.588 bn
+1.15 bn
6.24%
1 ene 1995 año
20.063 bn
+475.49 millones
2.43%
1 ene 1996 año
23.961 bn
+3.898 bn
19.43%
1 ene 1997 año
25.189 bn
+1.228 bn
5.13%
1 ene 1998 año
25.83 bn
+640.31 millones
2.54%
1 ene 1999 año
26.126 bn
+295.959 millones
1.15%
1 ene 2000 año
24.55 bn
-1.576 bn
-6.03%
1 ene 2001 año
24.454 bn
-95.28 millones
-0.39%
1 ene 2002 año
26.418 bn
+1.964 bn
8.03%
1 ene 2003 año
27.085 bn
+666.919 millones
2.52%
1 ene 2004 año
32.13 bn
+5.045 bn
18.63%
1 ene 2005 año
39.391 bn
+7.261 bn
22.6%
1 ene 2006 año
46.598 bn
+7.207 bn
18.3%
1 ene 2007 año
59.118 bn
+12.52 bn
26.87%
1 ene 2008 año
76.75 bn
+17.632 bn
29.83%
1 ene 2009 año
99.91 bn
+23.16 bn
30.18%
1 ene 2010 año
86.649 bn
-13.261 bn
-13.27%
1 ene 2011 año
97.725 bn
+11.076 bn
12.78%
1 ene 2012 año
116.241 bn
+18.516 bn
18.95%
1 ene 2013 año
115.531 bn
-710.397 millones
-0.61%
1 ene 2014 año
115.265 bn
-266.1 millones
-0.23%
1 ene 2015 año
121.624 bn
+6.359 bn
5.52%
Ranking de los países por los datos estadísticos actuales


Comentarios: