29
/es/
es
AIzaSyAYiBZKx7MnpbEhh9jyipgxe19OcubqV5w
April 1, 2024
105774
China
CHN
true
2
1
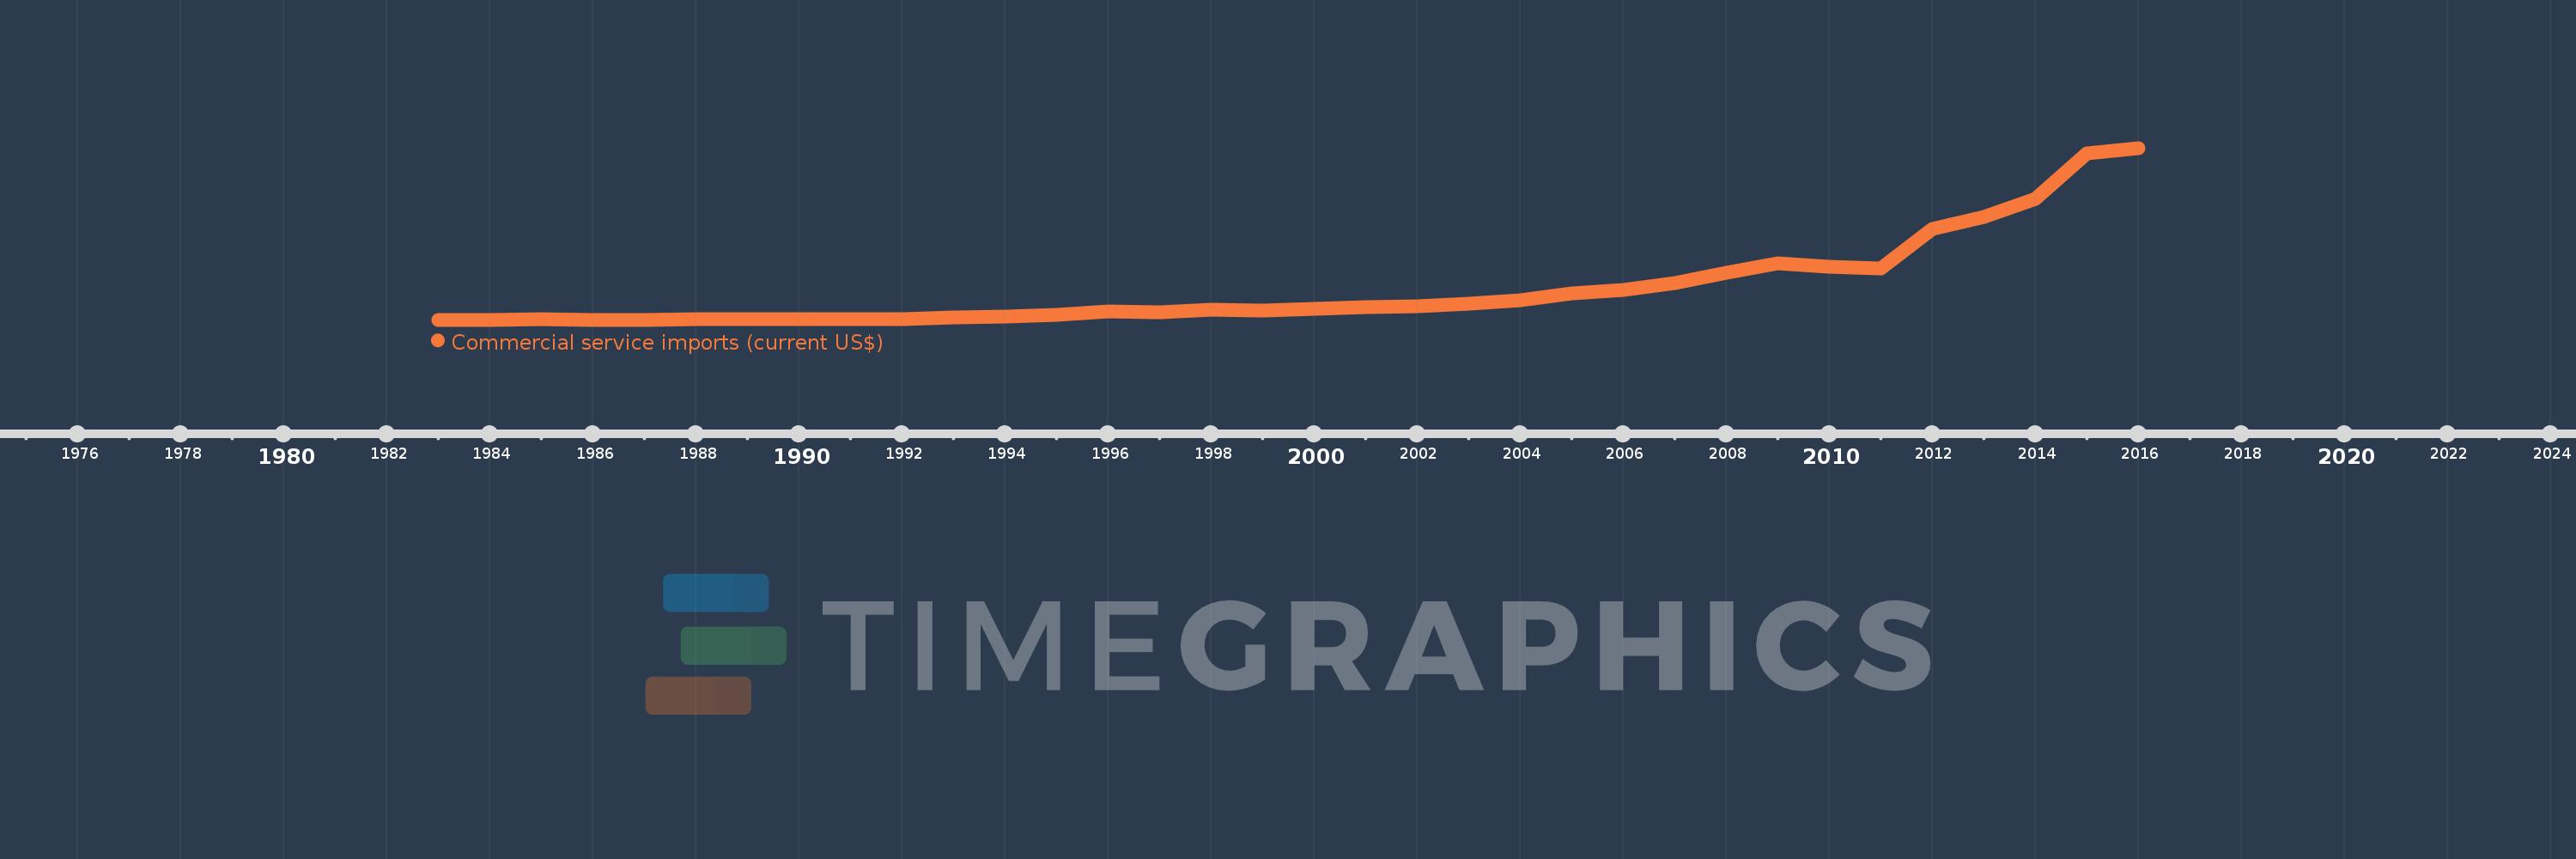
Commercial service imports (current US$)
2016,2015,2014,2013,2012,2011,2010,2009,2008,2007,2006,2005,2004,2003,2002,2001,2000,1999,1998,1997,1996,1995,1994,1993,1992,1991,1990,1989,1988,1987,1986,1985,1984,1983
Estas estadísticas en otros países:
AfghanistanAlbaniaAlgeriaAngolaAntigua and BarbudaArab WorldArgentinaArmeniaArubaAustraliaAustriaAzerbaijanBahamas, TheBahrainBangladeshBarbadosBelarusBelgiumBelizeBeninBermudaBhutanBoliviaBosnia and HerzegovinaBotswanaBrazilBrunei DarussalamBulgariaBurkina FasoBurundiCabo VerdeCambodiaCameroonCanadaCaribbean small statesCentral African RepublicCentral Europe and the BalticsChadChileChinaColombiaComorosCongo, Dem. Rep.Congo, Rep.Costa RicaCote d'IvoireCroatiaCuracaoCyprusCzech RepublicDenmarkDjiboutiDominicaDominican RepublicEarly-demographic dividendEast Asia & PacificEast Asia & Pacific (excluding high income)East Asia & Pacific (IDA & IBRD countries)EcuadorEgypt, Arab Rep.El SalvadorEquatorial GuineaEritreaEstoniaEthiopiaEuro areaEurope & Central AsiaEurope & Central Asia (excluding high income)Europe & Central Asia (IDA & IBRD countries)European UnionFaroe IslandsFijiFinlandFragile and conflict affected situationsFranceFrench PolynesiaGabonGambia, TheGeorgiaGermanyGhanaGreeceGrenadaGuatemalaGuineaGuinea-BissauGuyanaHaitiHeavily indebted poor countries (HIPC)High incomeHondurasHong Kong SAR, ChinaHungaryIBRD onlyIcelandIDA & IBRD totalIDA blendIDA onlyIDA totalIndiaIndonesiaIran, Islamic Rep.IraqIrelandIsraelItalyJamaicaJapanJordanKazakhstanKenyaKiribatiKorea, Rep.KosovoKuwaitKyrgyz RepublicLao PDRLate-demographic dividendLatin America & Caribbean Latin America & Caribbean (excluding high income)Latin America & the Caribbean (IDA & IBRD countries)LatviaLeast developed countries: UN classificationLebanonLesothoLiberiaLibyaLithuaniaLow & middle incomeLow incomeLower middle incomeLuxembourgMacao SAR, ChinaMacedonia, FYRMadagascarMalawiMalaysiaMaldivesMaliMaltaMarshall IslandsMauritaniaMauritiusMexicoMicronesia, Fed. Sts.Middle East & North Africa (excluding high income)Middle East & North Africa (IDA & IBRD countries)Middle incomeMoldovaMongoliaMontenegroMoroccoMozambiqueMyanmarNamibiaNepalNetherlandsNew CaledoniaNew ZealandNicaraguaNigerNigeriaNorth AmericaNorwayOECD membersOmanOther small statesPacific island small statesPakistanPalauPanamaPapua New GuineaParaguayPeruPhilippinesPolandPortugalPost-demographic dividendPre-demographic dividendQatarRomaniaRussian FederationRwandaSamoaSao Tome and PrincipeSaudi ArabiaSenegalSerbiaSeychellesSierra LeoneSingaporeSint Maarten (Dutch part)Slovak RepublicSloveniaSmall statesSolomon IslandsSouth AfricaSouth AsiaSouth Asia (IDA & IBRD)South SudanSpainSri LankaSt. Kitts and NevisSt. LuciaSt. Vincent and the GrenadinesSub-Saharan Africa Sub-Saharan Africa (excluding high income)Sub-Saharan Africa (IDA & IBRD countries)SudanSurinameSwazilandSwedenSwitzerlandSyrian Arab RepublicTajikistanTanzaniaThailandTimor-LesteTogoTongaTrinidad and TobagoTunisiaTurkeyTuvaluUgandaUkraineUnited KingdomUnited StatesUpper middle incomeUruguayVanuatuVenezuela, RBVietnamWest Bank and GazaWorldYemen, Rep.ZambiaZimbabwe línea de tiempo (timeline):
En esta escala de tiempo se presenta un gráfico de 1983 y 2016 de China. Los datos de 1982 están ausentes. El número de observaciones reales por fecha: 34.
Fuente (nombre):
Indicadores del desarrollo mundial
Fuente (organización):
International Monetary Fund, Balance of Payments Statistics Yearbook and data files.
Categorías:
Private Sector, Trade
Se ha actualizado:
23 abr 2017 año
Los indicadores de los cambios de valor en los últimos años
Mínimo:
1.84 bn
1 ene 1984 año
Máximo:
466.33 bn
1 ene 2016 año
A la fecha de observación
Valor
Cambio absoluto
El cambio con respecto al valor anterior
1 ene 1983 año
1.865 bn
+1.865 bn
0.0%
1 ene 1984 año
1.84 bn
-25.0 millones
-1.34%
1 ene 1985 año
2.634 bn
+794.0 millones
43.15%
1 ene 1986 año
2.261 bn
-373.0 millones
-14.16%
1 ene 1987 año
2.025 bn
-236.0 millones
-10.44%
1 ene 1988 año
2.335 bn
+310.0 millones
15.31%
1 ene 1989 año
3.326 bn
+991.0 millones
42.44%
1 ene 1990 año
3.573 bn
+247.0 millones
7.43%
1 ene 1991 año
4.113 bn
+540.0 millones
15.11%
1 ene 1992 año
3.937 bn
-176.0 millones
-4.28%
1 ene 1993 año
9.207 bn
+5.27 bn
133.86%
1 ene 1994 año
11.563 bn
+2.356 bn
25.59%
1 ene 1995 año
15.781 bn
+4.218 bn
36.48%
1 ene 1996 año
24.635 bn
+8.854 bn
56.1%
1 ene 1997 año
22.369 bn
-2.266 bn
-9.2%
1 ene 1998 año
28.035 bn
+5.666 bn
25.33%
1 ene 1999 año
26.999 bn
-1.036 bn
-3.7%
1 ene 2000 año
31.485 bn
+4.486 bn
16.62%
1 ene 2001 año
36.096 bn
+4.611 bn
14.64%
1 ene 2002 año
39.222 bn
+3.126 bn
8.66%
1 ene 2003 año
46.314 bn
+7.092 bn
18.08%
1 ene 2004 año
55.093 bn
+8.778 bn
18.95%
1 ene 2005 año
72.35 bn
+17.257 bn
31.32%
1 ene 2006 año
83.348 bn
+10.998 bn
15.2%
1 ene 2007 año
100.332 bn
+16.984 bn
20.38%
1 ene 2008 año
128.269 bn
+27.937 bn
27.84%
1 ene 2009 año
155.477 bn
+27.208 bn
21.21%
1 ene 2010 año
145.139 bn
-10.337 bn
-6.65%
1 ene 2011 año
139.787 bn
-5.353 bn
-3.69%
1 ene 2012 año
246.779 bn
+106.993 bn
76.54%
1 ene 2013 año
280.26 bn
+33.481 bn
13.57%
1 ene 2014 año
329.419 bn
+49.158 bn
17.54%
1 ene 2015 año
450.805 bn
+121.386 bn
36.85%
1 ene 2016 año
466.33 bn
+15.525 bn
3.44%
Ranking de los países por los datos estadísticos actuales


Comentarios: