29
/es/
es
AIzaSyAYiBZKx7MnpbEhh9jyipgxe19OcubqV5w
April 1, 2024
256145
Sweden
SWE
true
2
1
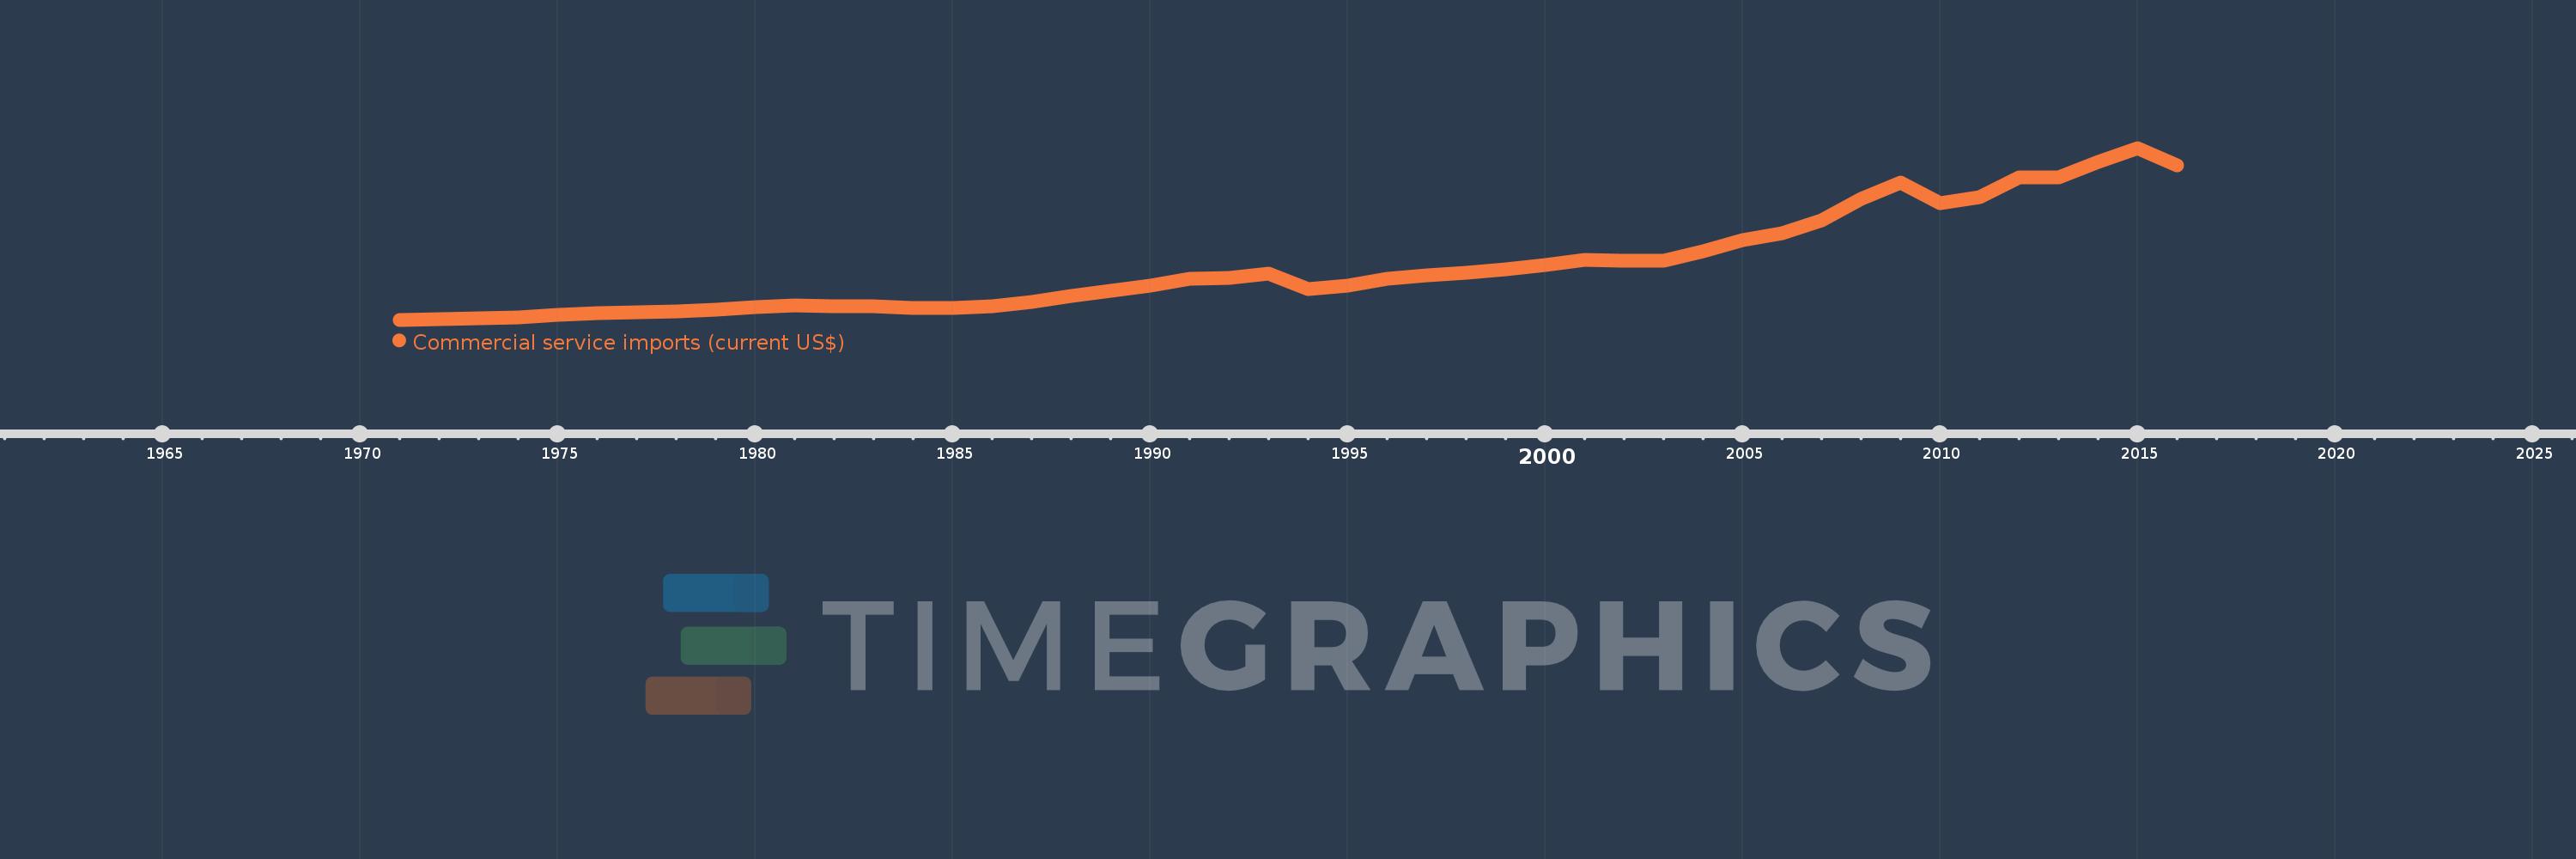
Commercial service imports (current US$)
2016,2015,2014,2013,2012,2011,2010,2009,2008,2007,2006,2005,2004,2003,2002,2001,2000,1999,1998,1997,1996,1995,1994,1993,1992,1991,1990,1989,1988,1987,1986,1985,1984,1983,1982,1981,1980,1979,1978,1977,1976,1975,1974,1973,1972,1971
Estas estadísticas en otros países:
AfghanistanAlbaniaAlgeriaAngolaAntigua and BarbudaArab WorldArgentinaArmeniaArubaAustraliaAustriaAzerbaijanBahamas, TheBahrainBangladeshBarbadosBelarusBelgiumBelizeBeninBermudaBhutanBoliviaBosnia and HerzegovinaBotswanaBrazilBrunei DarussalamBulgariaBurkina FasoBurundiCabo VerdeCambodiaCameroonCanadaCaribbean small statesCentral African RepublicCentral Europe and the BalticsChadChileChinaColombiaComorosCongo, Dem. Rep.Congo, Rep.Costa RicaCote d'IvoireCroatiaCuracaoCyprusCzech RepublicDenmarkDjiboutiDominicaDominican RepublicEarly-demographic dividendEast Asia & PacificEast Asia & Pacific (excluding high income)East Asia & Pacific (IDA & IBRD countries)EcuadorEgypt, Arab Rep.El SalvadorEquatorial GuineaEritreaEstoniaEthiopiaEuro areaEurope & Central AsiaEurope & Central Asia (excluding high income)Europe & Central Asia (IDA & IBRD countries)European UnionFaroe IslandsFijiFinlandFragile and conflict affected situationsFranceFrench PolynesiaGabonGambia, TheGeorgiaGermanyGhanaGreeceGrenadaGuatemalaGuineaGuinea-BissauGuyanaHaitiHeavily indebted poor countries (HIPC)High incomeHondurasHong Kong SAR, ChinaHungaryIBRD onlyIcelandIDA & IBRD totalIDA blendIDA onlyIDA totalIndiaIndonesiaIran, Islamic Rep.IraqIrelandIsraelItalyJamaicaJapanJordanKazakhstanKenyaKiribatiKorea, Rep.KosovoKuwaitKyrgyz RepublicLao PDRLate-demographic dividendLatin America & Caribbean Latin America & Caribbean (excluding high income)Latin America & the Caribbean (IDA & IBRD countries)LatviaLeast developed countries: UN classificationLebanonLesothoLiberiaLibyaLithuaniaLow & middle incomeLow incomeLower middle incomeLuxembourgMacao SAR, ChinaMacedonia, FYRMadagascarMalawiMalaysiaMaldivesMaliMaltaMarshall IslandsMauritaniaMauritiusMexicoMicronesia, Fed. Sts.Middle East & North Africa (excluding high income)Middle East & North Africa (IDA & IBRD countries)Middle incomeMoldovaMongoliaMontenegroMoroccoMozambiqueMyanmarNamibiaNepalNetherlandsNew CaledoniaNew ZealandNicaraguaNigerNigeriaNorth AmericaNorwayOECD membersOmanOther small statesPacific island small statesPakistanPalauPanamaPapua New GuineaParaguayPeruPhilippinesPolandPortugalPost-demographic dividendPre-demographic dividendQatarRomaniaRussian FederationRwandaSamoaSao Tome and PrincipeSaudi ArabiaSenegalSerbiaSeychellesSierra LeoneSingaporeSint Maarten (Dutch part)Slovak RepublicSloveniaSmall statesSolomon IslandsSouth AfricaSouth AsiaSouth Asia (IDA & IBRD)South SudanSpainSri LankaSt. Kitts and NevisSt. LuciaSt. Vincent and the GrenadinesSub-Saharan Africa Sub-Saharan Africa (excluding high income)Sub-Saharan Africa (IDA & IBRD countries)SudanSurinameSwazilandSwedenSwitzerlandSyrian Arab RepublicTajikistanTanzaniaThailandTimor-LesteTogoTongaTrinidad and TobagoTunisiaTurkeyTuvaluUgandaUkraineUnited KingdomUnited StatesUpper middle incomeUruguayVanuatuVenezuela, RBVietnamWest Bank and GazaWorldYemen, Rep.ZambiaZimbabwe línea de tiempo (timeline):
En esta escala de tiempo se presenta un gráfico de 1971 y 2016 de Sweden. Los datos de 1970 están ausentes. El número de observaciones reales por fecha: 46.
Fuente (nombre):
Indicadores del desarrollo mundial
Fuente (organización):
International Monetary Fund, Balance of Payments Statistics Yearbook and data files.
Categorías:
Private Sector, Trade
Se ha actualizado:
23 abr 2017 año
Los indicadores de los cambios de valor en los últimos años
Mínimo:
1.761 bn
1 ene 1971 año
Máximo:
65.627 bn
1 ene 2015 año
A la fecha de observación
Valor
Cambio absoluto
El cambio con respecto al valor anterior
1 ene 1971 año
1.761 bn
+1.761 bn
0.0%
1 ene 1972 año
1.937 bn
+176.223 millones
10.01%
1 ene 1973 año
2.264 bn
+326.338 millones
16.85%
1 ene 1974 año
2.745 bn
+481.878 millones
21.29%
1 ene 1975 año
3.521 bn
+775.291 millones
28.24%
1 ene 1976 año
4.108 bn
+587.196 millones
16.68%
1 ene 1977 año
4.473 bn
+365.224 millones
8.89%
1 ene 1978 año
4.983 bn
+510.12 millones
11.4%
1 ene 1979 año
5.548 bn
+564.899 millones
11.34%
1 ene 1980 año
6.415 bn
+866.477 millones
15.62%
1 ene 1981 año
6.952 bn
+536.918 millones
8.37%
1 ene 1982 año
6.804 bn
-148.006 millones
-2.13%
1 ene 1983 año
6.854 bn
+50.647 millones
0.74%
1 ene 1984 año
6.166 bn
-688.625 millones
-10.05%
1 ene 1985 año
6.281 bn
+115.029 millones
1.87%
1 ene 1986 año
6.619 bn
+338.816 millones
5.39%
1 ene 1987 año
8.395 bn
+1.776 bn
26.83%
1 ene 1988 año
10.527 bn
+2.132 bn
25.39%
1 ene 1989 año
12.567 bn
+2.04 bn
19.38%
1 ene 1990 año
14.297 bn
+1.73 bn
13.76%
1 ene 1991 año
16.928 bn
+2.631 bn
18.4%
1 ene 1992 año
17.239 bn
+310.986 millones
1.84%
1 ene 1993 año
18.802 bn
+1.562 bn
9.06%
1 ene 1994 año
13.102 bn
-5.699 bn
-30.31%
1 ene 1995 año
14.378 bn
+1.276 bn
9.74%
1 ene 1996 año
16.841 bn
+2.463 bn
17.13%
1 ene 1997 año
18.375 bn
+1.533 bn
9.1%
1 ene 1998 año
19.148 bn
+773.314 millones
4.21%
1 ene 1999 año
20.509 bn
+1.361 bn
7.11%
1 ene 2000 año
22.154 bn
+1.646 bn
8.02%
1 ene 2001 año
24.127 bn
+1.973 bn
8.91%
1 ene 2002 año
23.547 bn
-580.094 millones
-2.4%
1 ene 2003 año
23.579 bn
+31.242 millones
0.13%
1 ene 2004 año
27.318 bn
+3.74 bn
15.86%
1 ene 2005 año
31.259 bn
+3.941 bn
14.43%
1 ene 2006 año
33.8 bn
+2.541 bn
8.13%
1 ene 2007 año
38.826 bn
+5.026 bn
14.87%
1 ene 2008 año
46.739 bn
+7.913 bn
20.38%
1 ene 2009 año
52.889 bn
+6.151 bn
13.16%
1 ene 2010 año
45.017 bn
-7.872 bn
-14.88%
1 ene 2011 año
47.288 bn
+2.271 bn
5.05%
1 ene 2012 año
54.637 bn
+7.349 bn
15.54%
1 ene 2013 año
54.593 bn
-43.844 millones
-0.08%
1 ene 2014 año
60.469 bn
+5.876 bn
10.76%
1 ene 2015 año
65.627 bn
+5.158 bn
8.53%
1 ene 2016 año
59.03 bn
-6.598 bn
-10.05%
Ranking de los países por los datos estadísticos actuales


Comentarios: