29
/es/
es
AIzaSyAYiBZKx7MnpbEhh9jyipgxe19OcubqV5w
April 1, 2024
38815
IDA only
IDX
false
2
1
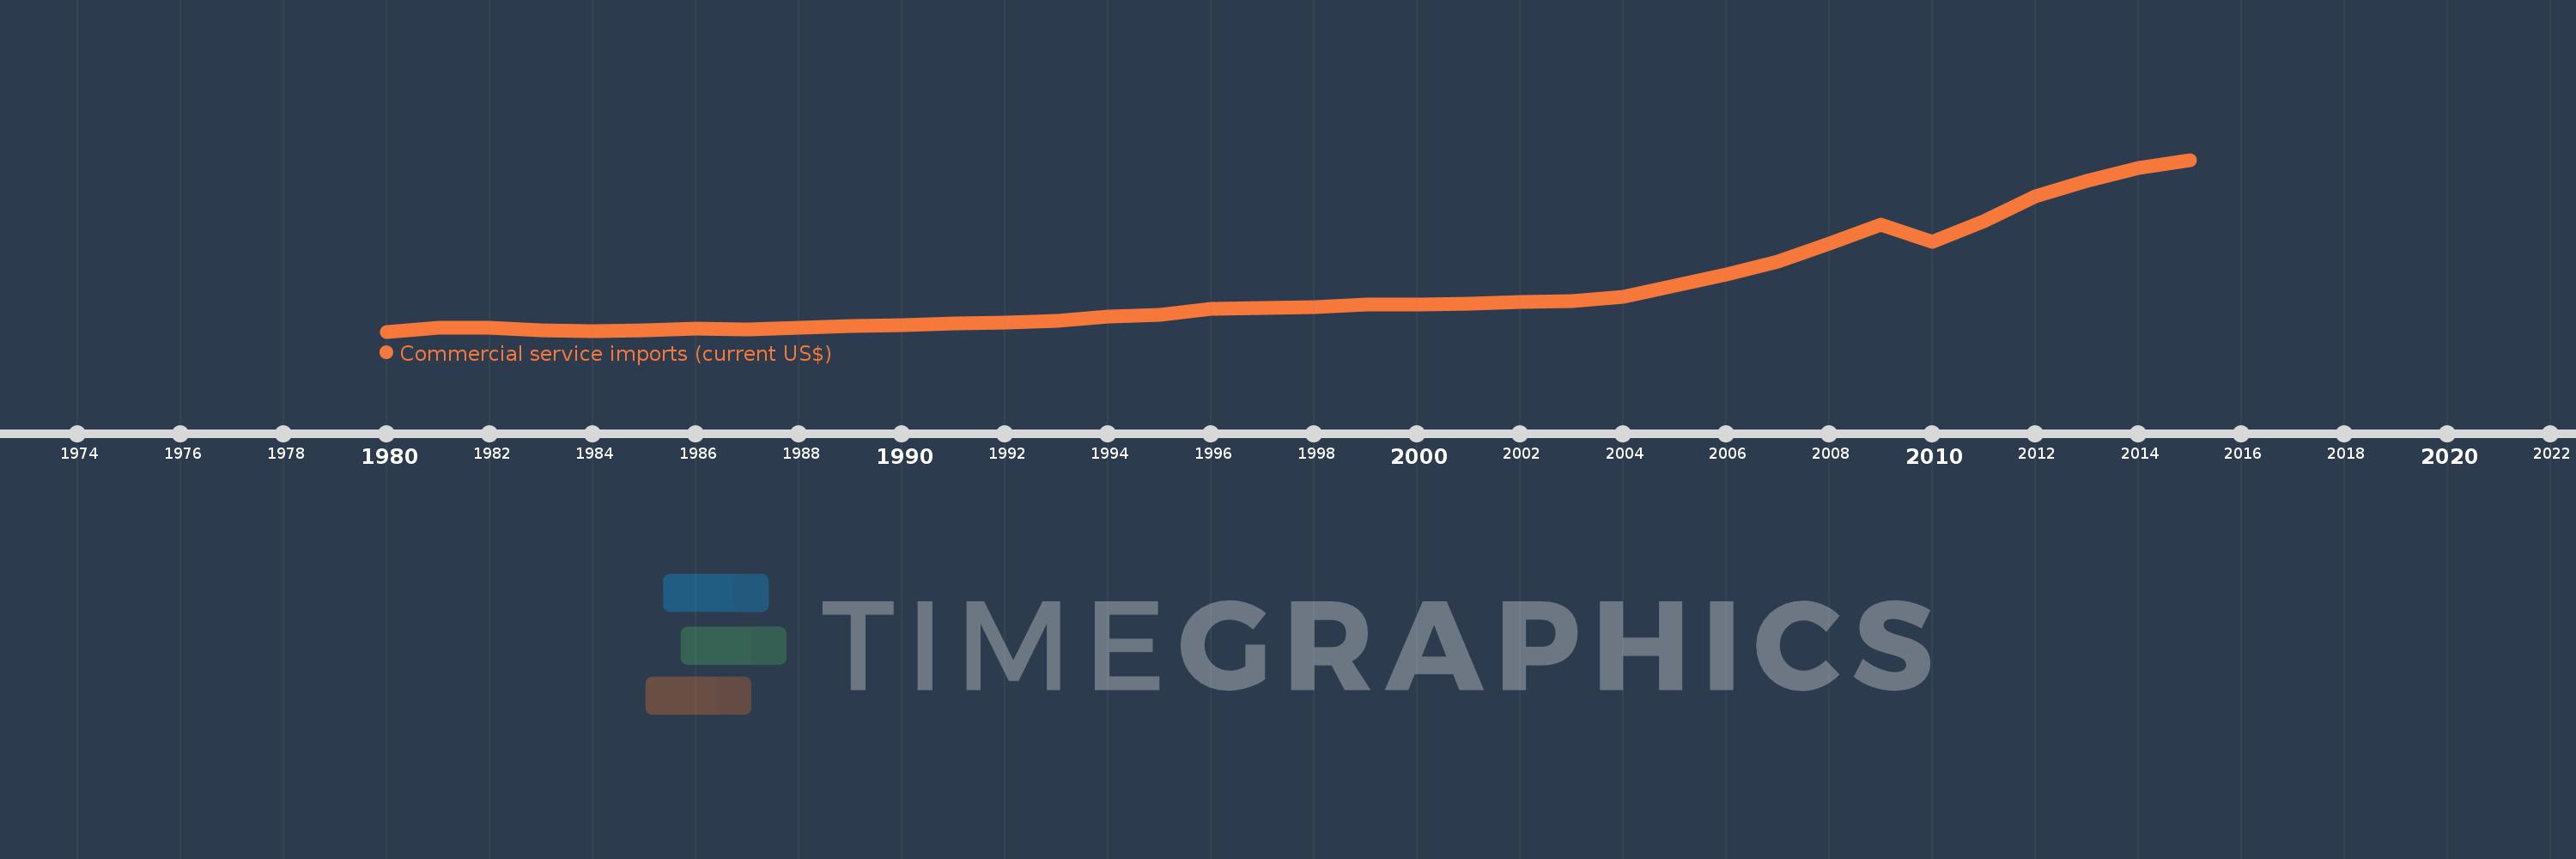
Commercial service imports (current US$)
2015,2014,2013,2012,2011,2010,2009,2008,2007,2006,2005,2004,2003,2002,2001,2000,1999,1998,1997,1996,1995,1994,1993,1992,1991,1990,1989,1988,1987,1986,1985,1984,1983,1982,1981,1980
Estas estadísticas en otros países:
AfghanistanAlbaniaAlgeriaAngolaAntigua and BarbudaArab WorldArgentinaArmeniaArubaAustraliaAustriaAzerbaijanBahamas, TheBahrainBangladeshBarbadosBelarusBelgiumBelizeBeninBermudaBhutanBoliviaBosnia and HerzegovinaBotswanaBrazilBrunei DarussalamBulgariaBurkina FasoBurundiCabo VerdeCambodiaCameroonCanadaCaribbean small statesCentral African RepublicCentral Europe and the BalticsChadChileChinaColombiaComorosCongo, Dem. Rep.Congo, Rep.Costa RicaCote d'IvoireCroatiaCuracaoCyprusCzech RepublicDenmarkDjiboutiDominicaDominican RepublicEarly-demographic dividendEast Asia & PacificEast Asia & Pacific (excluding high income)East Asia & Pacific (IDA & IBRD countries)EcuadorEgypt, Arab Rep.El SalvadorEquatorial GuineaEritreaEstoniaEthiopiaEuro areaEurope & Central AsiaEurope & Central Asia (excluding high income)Europe & Central Asia (IDA & IBRD countries)European UnionFaroe IslandsFijiFinlandFragile and conflict affected situationsFranceFrench PolynesiaGabonGambia, TheGeorgiaGermanyGhanaGreeceGrenadaGuatemalaGuineaGuinea-BissauGuyanaHaitiHeavily indebted poor countries (HIPC)High incomeHondurasHong Kong SAR, ChinaHungaryIBRD onlyIcelandIDA & IBRD totalIDA blendIDA onlyIDA totalIndiaIndonesiaIran, Islamic Rep.IraqIrelandIsraelItalyJamaicaJapanJordanKazakhstanKenyaKiribatiKorea, Rep.KosovoKuwaitKyrgyz RepublicLao PDRLate-demographic dividendLatin America & Caribbean Latin America & Caribbean (excluding high income)Latin America & the Caribbean (IDA & IBRD countries)LatviaLeast developed countries: UN classificationLebanonLesothoLiberiaLibyaLithuaniaLow & middle incomeLow incomeLower middle incomeLuxembourgMacao SAR, ChinaMacedonia, FYRMadagascarMalawiMalaysiaMaldivesMaliMaltaMarshall IslandsMauritaniaMauritiusMexicoMicronesia, Fed. Sts.Middle East & North Africa (excluding high income)Middle East & North Africa (IDA & IBRD countries)Middle incomeMoldovaMongoliaMontenegroMoroccoMozambiqueMyanmarNamibiaNepalNetherlandsNew CaledoniaNew ZealandNicaraguaNigerNigeriaNorth AmericaNorwayOECD membersOmanOther small statesPacific island small statesPakistanPalauPanamaPapua New GuineaParaguayPeruPhilippinesPolandPortugalPost-demographic dividendPre-demographic dividendQatarRomaniaRussian FederationRwandaSamoaSao Tome and PrincipeSaudi ArabiaSenegalSerbiaSeychellesSierra LeoneSingaporeSint Maarten (Dutch part)Slovak RepublicSloveniaSmall statesSolomon IslandsSouth AfricaSouth AsiaSouth Asia (IDA & IBRD)South SudanSpainSri LankaSt. Kitts and NevisSt. LuciaSt. Vincent and the GrenadinesSub-Saharan Africa Sub-Saharan Africa (excluding high income)Sub-Saharan Africa (IDA & IBRD countries)SudanSurinameSwazilandSwedenSwitzerlandSyrian Arab RepublicTajikistanTanzaniaThailandTimor-LesteTogoTongaTrinidad and TobagoTunisiaTurkeyTuvaluUgandaUkraineUnited KingdomUnited StatesUpper middle incomeUruguayVanuatuVenezuela, RBVietnamWest Bank and GazaWorldYemen, Rep.ZambiaZimbabwe línea de tiempo (timeline):
En esta escala de tiempo se presenta un gráfico de 1980 y 2015 de IDA only. Los datos de 1979 están ausentes. El número de observaciones reales por fecha: 36.
Fuente (nombre):
Indicadores del desarrollo mundial
Fuente (organización):
International Monetary Fund, Balance of Payments Statistics Yearbook and data files.
Categorías:
Private Sector, Trade
Se ha actualizado:
23 abr 2017 año
Los indicadores de los cambios de valor en los últimos años
Mínimo:
7.003 bn
1 ene 1980 año
Máximo:
74.494 bn
1 ene 2015 año
A la fecha de observación
Valor
Cambio absoluto
El cambio con respecto al valor anterior
1 ene 1980 año
7.003 bn
+7.003 bn
0.0%
1 ene 1981 año
8.542 bn
+1.539 bn
21.97%
1 ene 1982 año
8.614 bn
+72.283 millones
0.85%
1 ene 1983 año
7.655 bn
-958.474 millones
-11.13%
1 ene 1984 año
7.315 bn
-340.096 millones
-4.44%
1 ene 1985 año
7.484 bn
+169.174 millones
2.31%
1 ene 1986 año
8.064 bn
+579.191 millones
7.74%
1 ene 1987 año
7.772 bn
-291.533 millones
-3.62%
1 ene 1988 año
8.552 bn
+780.24 millones
10.04%
1 ene 1989 año
9.107 bn
+554.678 millones
6.49%
1 ene 1990 año
9.593 bn
+486.204 millones
5.34%
1 ene 1991 año
10.242 bn
+648.827 millones
6.76%
1 ene 1992 año
10.48 bn
+237.614 millones
2.32%
1 ene 1993 año
11.283 bn
+803.478 millones
7.67%
1 ene 1994 año
12.815 bn
+1.531 bn
13.57%
1 ene 1995 año
13.614 bn
+799.852 millones
6.24%
1 ene 1996 año
15.977 bn
+2.363 bn
17.36%
1 ene 1997 año
16.239 bn
+261.552 millones
1.64%
1 ene 1998 año
16.7 bn
+460.796 millones
2.84%
1 ene 1999 año
17.561 bn
+861.537 millones
5.16%
1 ene 2000 año
17.726 bn
+164.577 millones
0.94%
1 ene 2001 año
17.997 bn
+271.19 millones
1.53%
1 ene 2002 año
18.498 bn
+501.184 millones
2.78%
1 ene 2003 año
18.958 bn
+459.96 millones
2.49%
1 ene 2004 año
20.73 bn
+1.771 bn
9.34%
1 ene 2005 año
25.132 bn
+4.402 bn
21.24%
1 ene 2006 año
29.298 bn
+4.166 bn
16.58%
1 ene 2007 año
34.371 bn
+5.073 bn
17.32%
1 ene 2008 año
41.65 bn
+7.279 bn
21.18%
1 ene 2009 año
48.969 bn
+7.318 bn
17.57%
1 ene 2010 año
42.243 bn
-6.726 bn
-13.73%
1 ene 2011 año
50.348 bn
+8.105 bn
19.19%
1 ene 2012 año
60.017 bn
+9.669 bn
19.2%
1 ene 2013 año
66.099 bn
+6.082 bn
10.13%
1 ene 2014 año
71.212 bn
+5.113 bn
7.74%
1 ene 2015 año
74.494 bn
+3.282 bn
4.61%
Ranking de los países por los datos estadísticos actuales


Comentarios: