29
/es/
es
AIzaSyAYiBZKx7MnpbEhh9jyipgxe19OcubqV5w
April 1, 2024
56805
South Asia
SAS
false
2
1
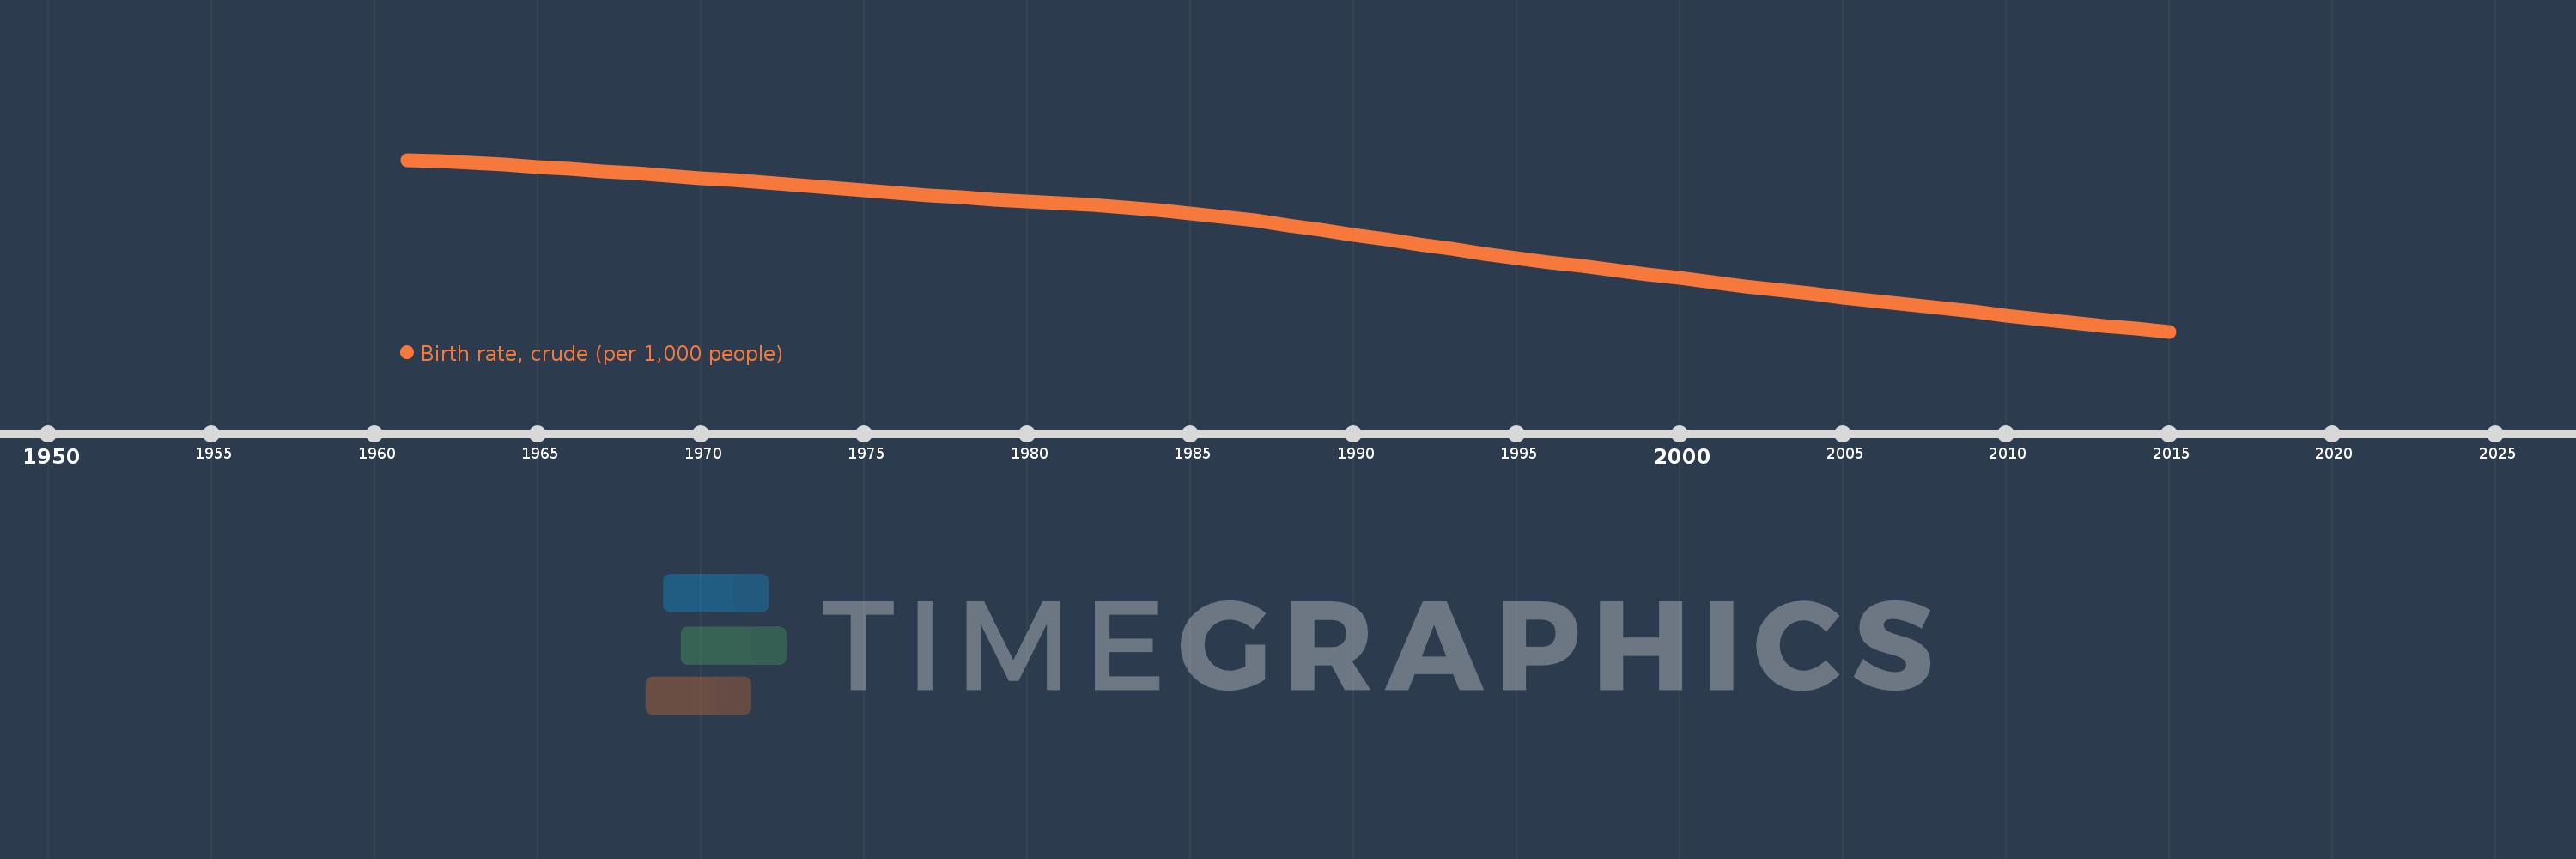
Birth rate, crude (per 1,000 people)
2015,2014,2013,2012,2011,2010,2009,2008,2007,2006,2005,2004,2003,2002,2001,2000,1999,1998,1997,1996,1995,1994,1993,1992,1991,1990,1989,1988,1987,1986,1985,1984,1983,1982,1981,1980,1979,1978,1977,1976,1975,1974,1973,1972,1971,1970,1969,1968,1967,1966,1965,1964,1963,1962,1961
Estas estadísticas en otros países:
AfghanistanAlbaniaAlgeriaAmerican SamoaAndorraAngolaAntigua and BarbudaArab WorldArgentinaArmeniaArubaAustraliaAustriaAzerbaijanBahamas, TheBahrainBangladeshBarbadosBelarusBelgiumBelizeBeninBermudaBhutanBoliviaBosnia and HerzegovinaBotswanaBrazilBrunei DarussalamBulgariaBurkina FasoBurundiCabo VerdeCambodiaCameroonCanadaCaribbean small statesCayman IslandsCentral African RepublicCentral Europe and the BalticsChadChannel IslandsChileChinaColombiaComorosCongo, Dem. Rep.Congo, Rep.Costa RicaCote d'IvoireCroatiaCubaCuracaoCyprusCzech RepublicDenmarkDjiboutiDominicaDominican RepublicEarly-demographic dividendEast Asia & PacificEast Asia & Pacific (excluding high income)East Asia & Pacific (IDA & IBRD countries)EcuadorEgypt, Arab Rep.El SalvadorEquatorial GuineaEritreaEstoniaEthiopiaEuro areaEurope & Central AsiaEurope & Central Asia (excluding high income)Europe & Central Asia (IDA & IBRD countries)European UnionFaroe IslandsFijiFinlandFragile and conflict affected situationsFranceFrench PolynesiaGabonGambia, TheGeorgiaGermanyGhanaGreeceGreenlandGrenadaGuamGuatemalaGuineaGuinea-BissauGuyanaHaitiHeavily indebted poor countries (HIPC)High incomeHondurasHong Kong SAR, ChinaHungaryIBRD onlyIcelandIDA & IBRD totalIDA blendIDA onlyIDA totalIndiaIndonesiaIran, Islamic Rep.IraqIrelandIsle of ManIsraelItalyJamaicaJapanJordanKazakhstanKenyaKiribatiKorea, Dem. People’s Rep.Korea, Rep.KosovoKuwaitKyrgyz RepublicLao PDRLate-demographic dividendLatin America & Caribbean Latin America & Caribbean (excluding high income)Latin America & the Caribbean (IDA & IBRD countries)LatviaLeast developed countries: UN classificationLebanonLesothoLiberiaLibyaLiechtensteinLithuaniaLow & middle incomeLow incomeLower middle incomeLuxembourgMacao SAR, ChinaMacedonia, FYRMadagascarMalawiMalaysiaMaldivesMaliMaltaMarshall IslandsMauritaniaMauritiusMexicoMicronesia, Fed. Sts.Middle East & North AfricaMiddle East & North Africa (excluding high income)Middle East & North Africa (IDA & IBRD countries)Middle incomeMoldovaMonacoMongoliaMontenegroMoroccoMozambiqueMyanmarNamibiaNepalNetherlandsNew CaledoniaNew ZealandNicaraguaNigerNigeriaNorth AmericaNorwayOECD membersOmanOther small statesPacific island small statesPakistanPalauPanamaPapua New GuineaParaguayPeruPhilippinesPolandPortugalPost-demographic dividendPre-demographic dividendPuerto RicoQatarRomaniaRussian FederationRwandaSamoaSan MarinoSao Tome and PrincipeSaudi ArabiaSenegalSerbiaSeychellesSierra LeoneSingaporeSint Maarten (Dutch part)Slovak RepublicSloveniaSmall statesSolomon IslandsSomaliaSouth AfricaSouth AsiaSouth Asia (IDA & IBRD)South SudanSpainSri LankaSt. Kitts and NevisSt. LuciaSt. Martin (French part)St. Vincent and the GrenadinesSub-Saharan Africa Sub-Saharan Africa (excluding high income)Sub-Saharan Africa (IDA & IBRD countries)SudanSurinameSwazilandSwedenSwitzerlandSyrian Arab RepublicTajikistanTanzaniaThailandTimor-LesteTogoTongaTrinidad and TobagoTunisiaTurkeyTurkmenistanUgandaUkraineUnited Arab EmiratesUnited KingdomUnited StatesUpper middle incomeUruguayUzbekistanVanuatuVenezuela, RBVietnamVirgin Islands (U.S.)West Bank and GazaWorldYemen, Rep.ZambiaZimbabwe línea de tiempo (timeline):
En esta escala de tiempo se presenta un gráfico de 1961 y 2015 de South Asia. Los datos de 1960 están ausentes. El número de observaciones reales por fecha: 55.
Fuente (nombre):
Indicadores del desarrollo mundial
Fuente (organización):
(1) United Nations Population Division. World Population Prospects, (2) Census reports and other statistical publications from national statistical offices, (3) Eurostat: Demographic Statistics, (4) United Nations Statistical Division. Population and Vital Statistics Reprot (various years), (5) U.S. Census Bureau: International Database, and (6) Secretariat of the Pacific Community: Statistics and Demography Programme.
Categorías:
Health
Se ha actualizado:
23 abr 2017 año
Los indicadores de los cambios de valor en los últimos años
Mínimo:
21.159
1 ene 2015 año
Máximo:
42.963
1 ene 1961 año
A la fecha de observación
Valor
Cambio absoluto
El cambio con respecto al valor anterior
1 ene 1961 año
42.963
+42.963
0.0%
1 ene 1962 año
42.774
-0.189
-0.44%
1 ene 1963 año
42.561
-0.213
-0.5%
1 ene 1964 año
42.327
-0.234
-0.55%
1 ene 1965 año
42.071
-0.256
-0.6%
1 ene 1966 año
41.8
-0.271
-0.64%
1 ene 1967 año
41.52
-0.28
-0.67%
1 ene 1968 año
41.237
-0.283
-0.68%
1 ene 1969 año
40.951
-0.286
-0.69%
1 ene 1970 año
40.665
-0.286
-0.7%
1 ene 1971 año
40.375
-0.29
-0.71%
1 ene 1972 año
40.077
-0.298
-0.74%
1 ene 1973 año
39.766
-0.311
-0.78%
1 ene 1974 año
39.442
-0.324
-0.81%
1 ene 1975 año
39.111
-0.331
-0.84%
1 ene 1976 año
38.786
-0.325
-0.83%
1 ene 1977 año
38.479
-0.307
-0.79%
1 ene 1978 año
38.199
-0.28
-0.73%
1 ene 1979 año
37.944
-0.255
-0.67%
1 ene 1980 año
37.705
-0.239
-0.63%
1 ene 1981 año
37.468
-0.237
-0.63%
1 ene 1982 año
37.217
-0.251
-0.67%
1 ene 1983 año
36.928
-0.289
-0.78%
1 ene 1984 año
36.591
-0.337
-0.91%
1 ene 1985 año
36.199
-0.392
-1.07%
1 ene 1986 año
35.747
-0.452
-1.25%
1 ene 1987 año
35.235
-0.513
-1.43%
1 ene 1988 año
34.675
-0.56
-1.59%
1 ene 1989 año
34.083
-0.592
-1.71%
1 ene 1990 año
33.469
-0.614
-1.8%
1 ene 1991 año
32.849
-0.62
-1.85%
1 ene 1992 año
32.235
-0.614
-1.87%
1 ene 1993 año
31.636
-0.599
-1.86%
1 ene 1994 año
31.057
-0.579
-1.83%
1 ene 1995 año
30.5
-0.557
-1.79%
1 ene 1996 año
29.967
-0.533
-1.75%
1 ene 1997 año
29.449
-0.518
-1.73%
1 ene 1998 año
28.94
-0.509
-1.73%
1 ene 1999 año
28.432
-0.508
-1.75%
1 ene 2000 año
27.925
-0.507
-1.78%
1 ene 2001 año
27.424
-0.501
-1.79%
1 ene 2002 año
26.93
-0.494
-1.8%
1 ene 2003 año
26.448
-0.482
-1.79%
1 ene 2004 año
25.978
-0.47
-1.78%
1 ene 2005 año
25.518
-0.46
-1.77%
1 ene 2006 año
25.062
-0.456
-1.79%
1 ene 2007 año
24.603
-0.459
-1.83%
1 ene 2008 año
24.138
-0.466
-1.89%
1 ene 2009 año
23.667
-0.471
-1.95%
1 ene 2010 año
23.194
-0.473
-2.0%
1 ene 2011 año
22.731
-0.463
-2.0%
1 ene 2012 año
22.288
-0.443
-1.95%
1 ene 2013 año
21.876
-0.412
-1.85%
1 ene 2014 año
21.5
-0.376
-1.72%
1 ene 2015 año
21.159
-0.341
-1.59%
Ranking de los países por los datos estadísticos actuales


Comentarios: