29
/es/
es
AIzaSyAYiBZKx7MnpbEhh9jyipgxe19OcubqV5w
April 1, 2024
260557
Tanzania
TZA
true
2
1
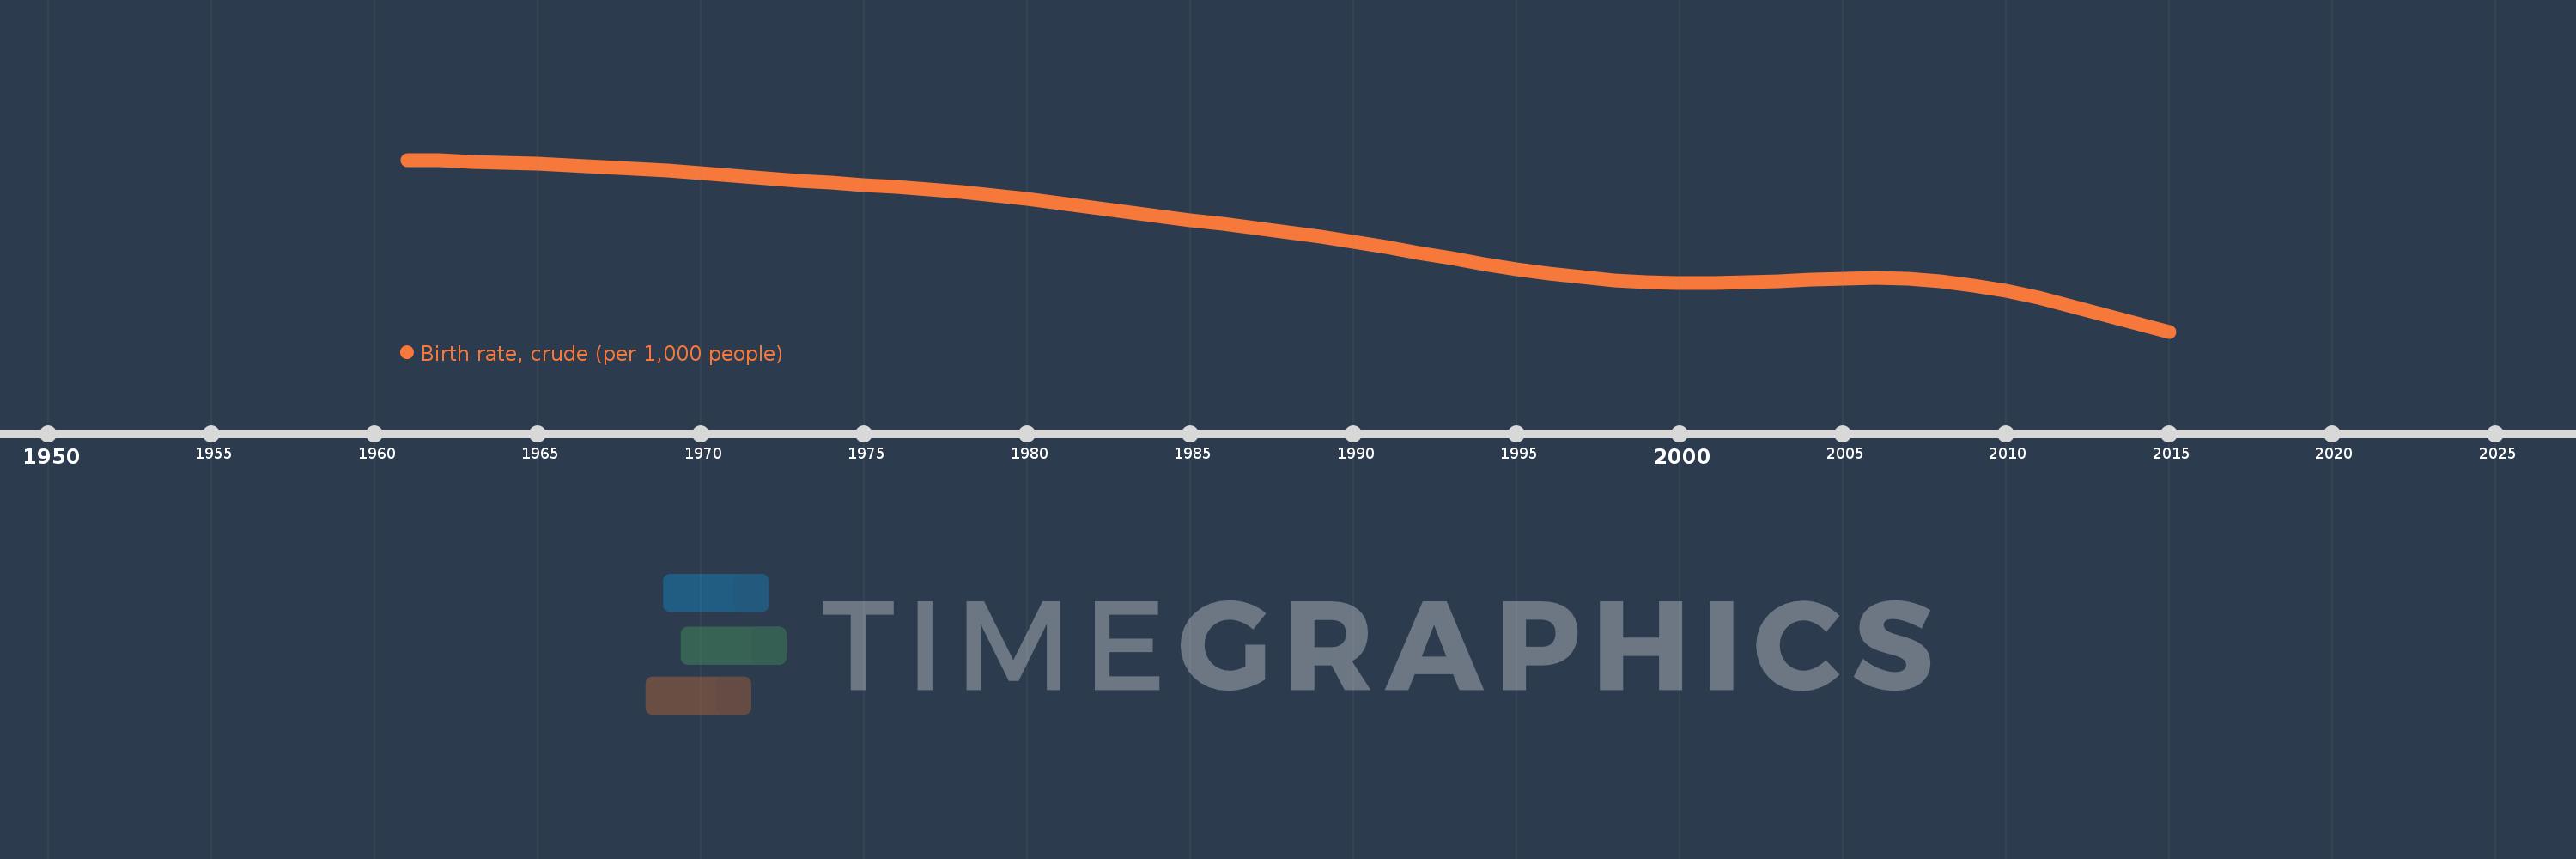
Birth rate, crude (per 1,000 people)
2015,2014,2013,2012,2011,2010,2009,2008,2007,2006,2005,2004,2003,2002,2001,2000,1999,1998,1997,1996,1995,1994,1993,1992,1991,1990,1989,1988,1987,1986,1985,1984,1983,1982,1981,1980,1979,1978,1977,1976,1975,1974,1973,1972,1971,1970,1969,1968,1967,1966,1965,1964,1963,1962,1961
Estas estadísticas en otros países:
AfghanistanAlbaniaAlgeriaAmerican SamoaAndorraAngolaAntigua and BarbudaArab WorldArgentinaArmeniaArubaAustraliaAustriaAzerbaijanBahamas, TheBahrainBangladeshBarbadosBelarusBelgiumBelizeBeninBermudaBhutanBoliviaBosnia and HerzegovinaBotswanaBrazilBrunei DarussalamBulgariaBurkina FasoBurundiCabo VerdeCambodiaCameroonCanadaCaribbean small statesCayman IslandsCentral African RepublicCentral Europe and the BalticsChadChannel IslandsChileChinaColombiaComorosCongo, Dem. Rep.Congo, Rep.Costa RicaCote d'IvoireCroatiaCubaCuracaoCyprusCzech RepublicDenmarkDjiboutiDominicaDominican RepublicEarly-demographic dividendEast Asia & PacificEast Asia & Pacific (excluding high income)East Asia & Pacific (IDA & IBRD countries)EcuadorEgypt, Arab Rep.El SalvadorEquatorial GuineaEritreaEstoniaEthiopiaEuro areaEurope & Central AsiaEurope & Central Asia (excluding high income)Europe & Central Asia (IDA & IBRD countries)European UnionFaroe IslandsFijiFinlandFragile and conflict affected situationsFranceFrench PolynesiaGabonGambia, TheGeorgiaGermanyGhanaGreeceGreenlandGrenadaGuamGuatemalaGuineaGuinea-BissauGuyanaHaitiHeavily indebted poor countries (HIPC)High incomeHondurasHong Kong SAR, ChinaHungaryIBRD onlyIcelandIDA & IBRD totalIDA blendIDA onlyIDA totalIndiaIndonesiaIran, Islamic Rep.IraqIrelandIsle of ManIsraelItalyJamaicaJapanJordanKazakhstanKenyaKiribatiKorea, Dem. People’s Rep.Korea, Rep.KosovoKuwaitKyrgyz RepublicLao PDRLate-demographic dividendLatin America & Caribbean Latin America & Caribbean (excluding high income)Latin America & the Caribbean (IDA & IBRD countries)LatviaLeast developed countries: UN classificationLebanonLesothoLiberiaLibyaLiechtensteinLithuaniaLow & middle incomeLow incomeLower middle incomeLuxembourgMacao SAR, ChinaMacedonia, FYRMadagascarMalawiMalaysiaMaldivesMaliMaltaMarshall IslandsMauritaniaMauritiusMexicoMicronesia, Fed. Sts.Middle East & North AfricaMiddle East & North Africa (excluding high income)Middle East & North Africa (IDA & IBRD countries)Middle incomeMoldovaMonacoMongoliaMontenegroMoroccoMozambiqueMyanmarNamibiaNepalNetherlandsNew CaledoniaNew ZealandNicaraguaNigerNigeriaNorth AmericaNorwayOECD membersOmanOther small statesPacific island small statesPakistanPalauPanamaPapua New GuineaParaguayPeruPhilippinesPolandPortugalPost-demographic dividendPre-demographic dividendPuerto RicoQatarRomaniaRussian FederationRwandaSamoaSan MarinoSao Tome and PrincipeSaudi ArabiaSenegalSerbiaSeychellesSierra LeoneSingaporeSint Maarten (Dutch part)Slovak RepublicSloveniaSmall statesSolomon IslandsSomaliaSouth AfricaSouth AsiaSouth Asia (IDA & IBRD)South SudanSpainSri LankaSt. Kitts and NevisSt. LuciaSt. Martin (French part)St. Vincent and the GrenadinesSub-Saharan Africa Sub-Saharan Africa (excluding high income)Sub-Saharan Africa (IDA & IBRD countries)SudanSurinameSwazilandSwedenSwitzerlandSyrian Arab RepublicTajikistanTanzaniaThailandTimor-LesteTogoTongaTrinidad and TobagoTunisiaTurkeyTurkmenistanUgandaUkraineUnited Arab EmiratesUnited KingdomUnited StatesUpper middle incomeUruguayUzbekistanVanuatuVenezuela, RBVietnamVirgin Islands (U.S.)West Bank and GazaWorldYemen, Rep.ZambiaZimbabwe línea de tiempo (timeline):
En esta escala de tiempo se presenta un gráfico de 1961 y 2015 de Tanzania. Los datos de 1960 están ausentes. El número de observaciones reales por fecha: 55.
Fuente (nombre):
Indicadores del desarrollo mundial
Fuente (organización):
(1) United Nations Population Division. World Population Prospects, (2) Census reports and other statistical publications from national statistical offices, (3) Eurostat: Demographic Statistics, (4) United Nations Statistical Division. Population and Vital Statistics Reprot (various years), (5) U.S. Census Bureau: International Database, and (6) Secretariat of the Pacific Community: Statistics and Demography Programme.
Categorías:
Health
Se ha actualizado:
23 abr 2017 año
Los indicadores de los cambios de valor en los últimos años
Mínimo:
39.015
1 ene 2015 año
Máximo:
49.296
1 ene 1961 año
A la fecha de observación
Valor
Cambio absoluto
El cambio con respecto al valor anterior
1 ene 1961 año
49.296
+49.296
0.0%
1 ene 1962 año
49.249
-0.047
-0.1%
1 ene 1963 año
49.191
-0.058
-0.12%
1 ene 1964 año
49.125
-0.066
-0.13%
1 ene 1965 año
49.053
-0.072
-0.15%
1 ene 1966 año
48.972
-0.081
-0.17%
1 ene 1967 año
48.877
-0.095
-0.19%
1 ene 1968 año
48.765
-0.112
-0.23%
1 ene 1969 año
48.635
-0.13
-0.27%
1 ene 1970 año
48.49
-0.145
-0.3%
1 ene 1971 año
48.338
-0.152
-0.31%
1 ene 1972 año
48.189
-0.149
-0.31%
1 ene 1973 año
48.049
-0.14
-0.29%
1 ene 1974 año
47.92
-0.129
-0.27%
1 ene 1975 año
47.799
-0.121
-0.25%
1 ene 1976 año
47.678
-0.121
-0.25%
1 ene 1977 año
47.543
-0.135
-0.28%
1 ene 1978 año
47.381
-0.162
-0.34%
1 ene 1979 año
47.187
-0.194
-0.41%
1 ene 1980 año
46.96
-0.227
-0.48%
1 ene 1981 año
46.707
-0.253
-0.54%
1 ene 1982 año
46.442
-0.265
-0.57%
1 ene 1983 año
46.177
-0.265
-0.57%
1 ene 1984 año
45.922
-0.255
-0.55%
1 ene 1985 año
45.679
-0.243
-0.53%
1 ene 1986 año
45.443
-0.236
-0.52%
1 ene 1987 año
45.203
-0.24
-0.53%
1 ene 1988 año
44.948
-0.255
-0.56%
1 ene 1989 año
44.673
-0.275
-0.61%
1 ene 1990 año
44.377
-0.296
-0.66%
1 ene 1991 año
44.061
-0.316
-0.71%
1 ene 1992 año
43.73
-0.331
-0.75%
1 ene 1993 año
43.393
-0.337
-0.77%
1 ene 1994 año
43.063
-0.33
-0.76%
1 ene 1995 año
42.754
-0.309
-0.72%
1 ene 1996 año
42.479
-0.275
-0.64%
1 ene 1997 año
42.256
-0.223
-0.52%
1 ene 1998 año
42.089
-0.167
-0.4%
1 ene 1999 año
41.979
-0.11
-0.26%
1 ene 2000 año
41.921
-0.058
-0.14%
1 ene 2001 año
41.917
-0.004
-0.01%
1 ene 2002 año
41.962
+0.045
0.11%
1 ene 2003 año
42.04
+0.078
0.19%
1 ene 2004 año
42.126
+0.086
0.2%
1 ene 2005 año
42.197
+0.071
0.17%
1 ene 2006 año
42.221
+0.024
0.06%
1 ene 2007 año
42.168
-0.053
-0.13%
1 ene 2008 año
42.023
-0.145
-0.34%
1 ene 2009 año
41.783
-0.24
-0.57%
1 ene 2010 año
41.447
-0.336
-0.8%
1 ene 2011 año
41.028
-0.419
-1.01%
1 ene 2012 año
40.546
-0.482
-1.17%
1 ene 2013 año
40.033
-0.513
-1.27%
1 ene 2014 año
39.518
-0.515
-1.29%
1 ene 2015 año
39.015
-0.503
-1.27%
Ranking de los países por los datos estadísticos actuales


Comentarios: