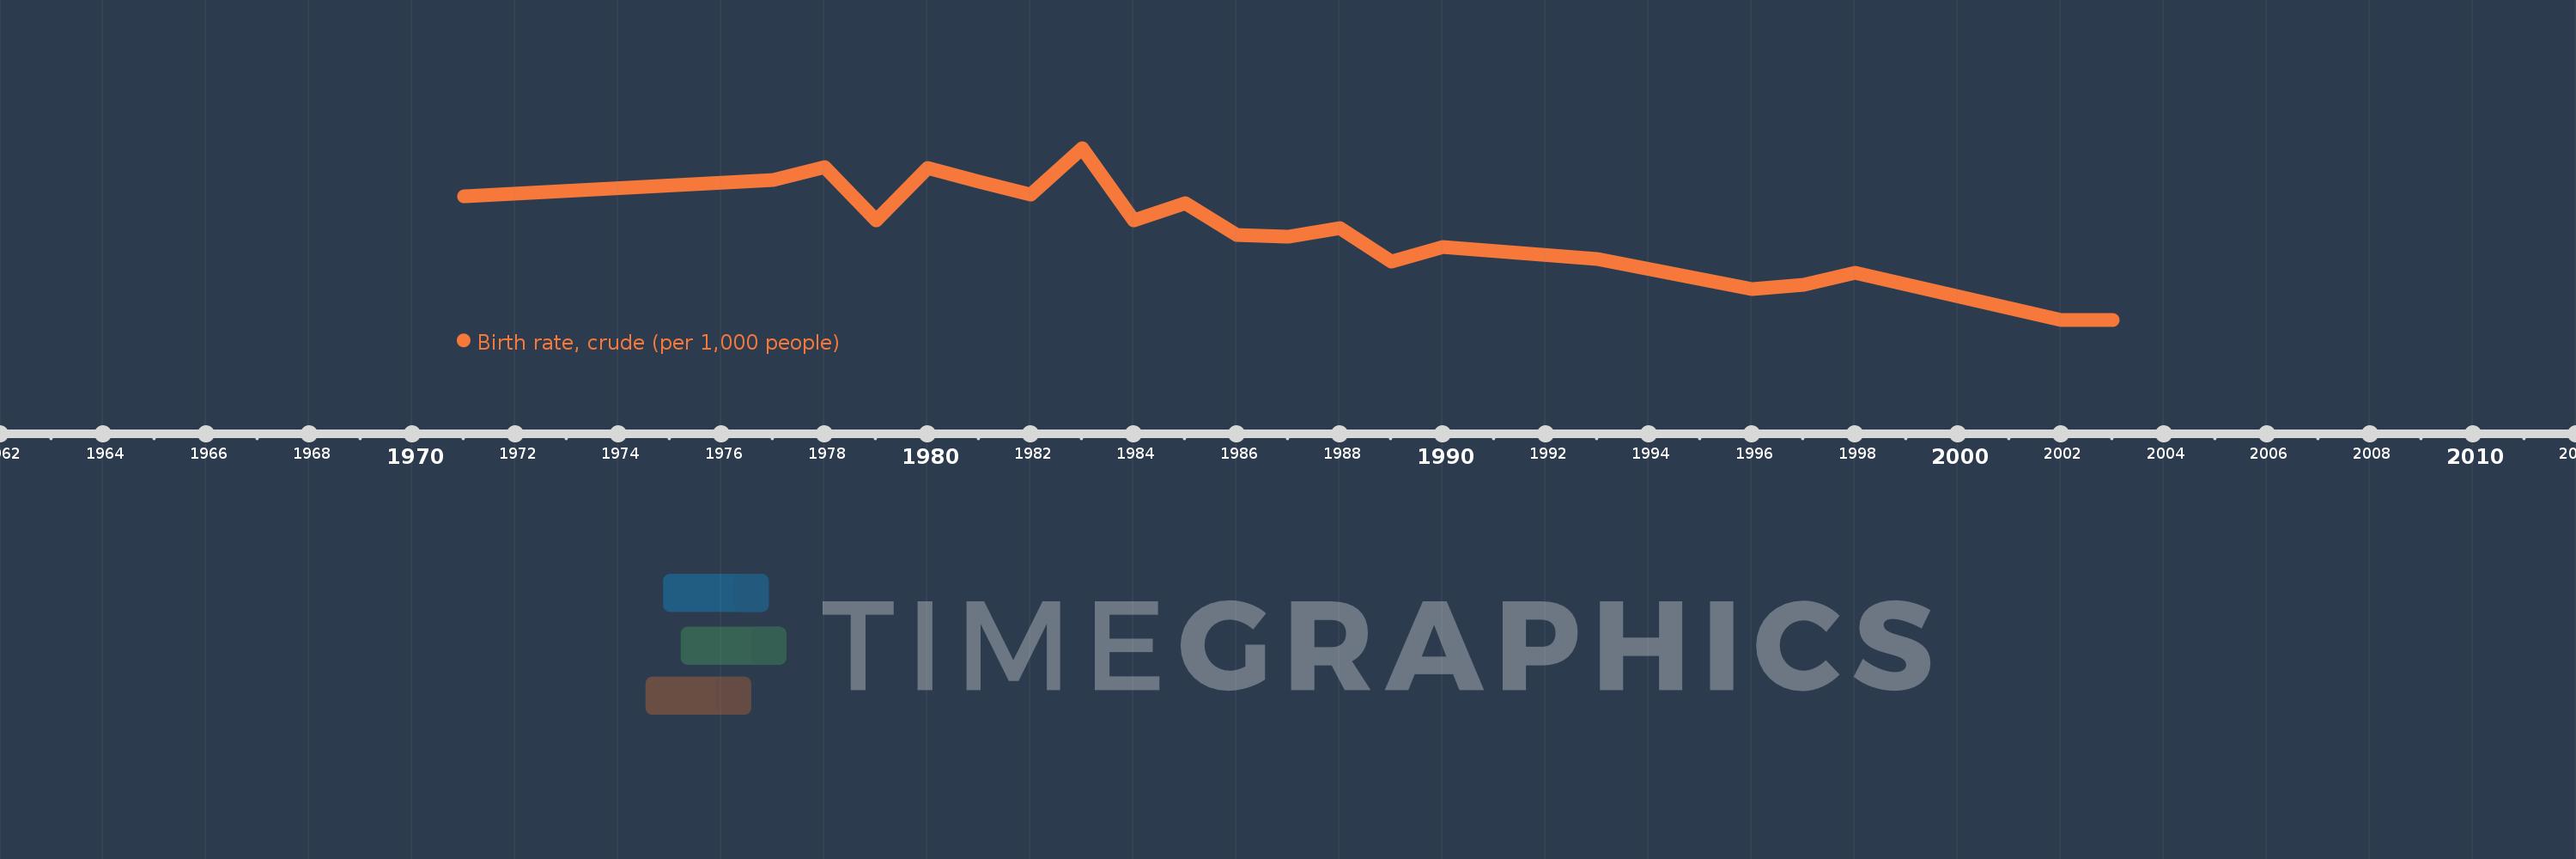
En esta escala de tiempo se presenta un gráfico de 1971 y 2003 de St. Kitts and Nevis. Los datos de 1970 están ausentes. El número de observaciones reales por fecha: 21.
Fuente (nombre):
Indicadores del desarrollo mundial
Fuente (organización):
(1) United Nations Population Division. World Population Prospects, (2) Census reports and other statistical publications from national statistical offices, (3) Eurostat: Demographic Statistics, (4) United Nations Statistical Division. Population and Vital Statistics Reprot (various years), (5) U.S. Census Bureau: International Database, and (6) Secretariat of the Pacific Community: Statistics and Demography Programme.
Categorías:
Health
Se ha actualizado:
23 abr 2017 año
Los indicadores de los cambios de valor en los últimos años
En promedio:
23.452
Mínimo:
17.3
1 ene 2002 año
Máximo:
29.1
1 ene 1983 año
A la fecha de observación
Valor
Cambio absoluto
El cambio con respecto al valor anterior
1 ene 1971 año
25.8
+25.8
0.0%
1 ene 1977 año
26.9
+1.1
4.26%
1 ene 1978 año
27.8
+0.9
3.35%
1 ene 1979 año
24.1
-3.7
-13.31%
1 ene 1980 año
27.7
+3.6
14.94%
1 ene 1981 año
26.8
-0.9
-3.25%
1 ene 1982 año
25.9
-0.9
-3.36%
1 ene 1983 año
29.1
+3.2
12.36%
1 ene 1984 año
24.1
-5.0
-17.18%
1 ene 1985 año
25.3
+1.2
4.98%
1 ene 1986 año
23.1
-2.2
-8.7%
1 ene 1987 año
23.0
-0.1
-0.43%
1 ene 1988 año
23.6
+0.6
2.61%
1 ene 1989 año
21.3
-2.3
-9.75%
1 ene 1990 año
22.3
+1.0
4.69%
1 ene 1993 año
21.5
-0.8
-3.59%
1 ene 1996 año
19.4
-2.1
-9.77%
1 ene 1997 año
19.7
+0.3
1.55%
1 ene 1998 año
20.5
+0.8
4.06%
1 ene 2002 año
17.3
-3.2
-15.61%
1 ene 2003 año
17.3
0.0
0.0%
Ranking de los países por los datos estadísticos actuales
