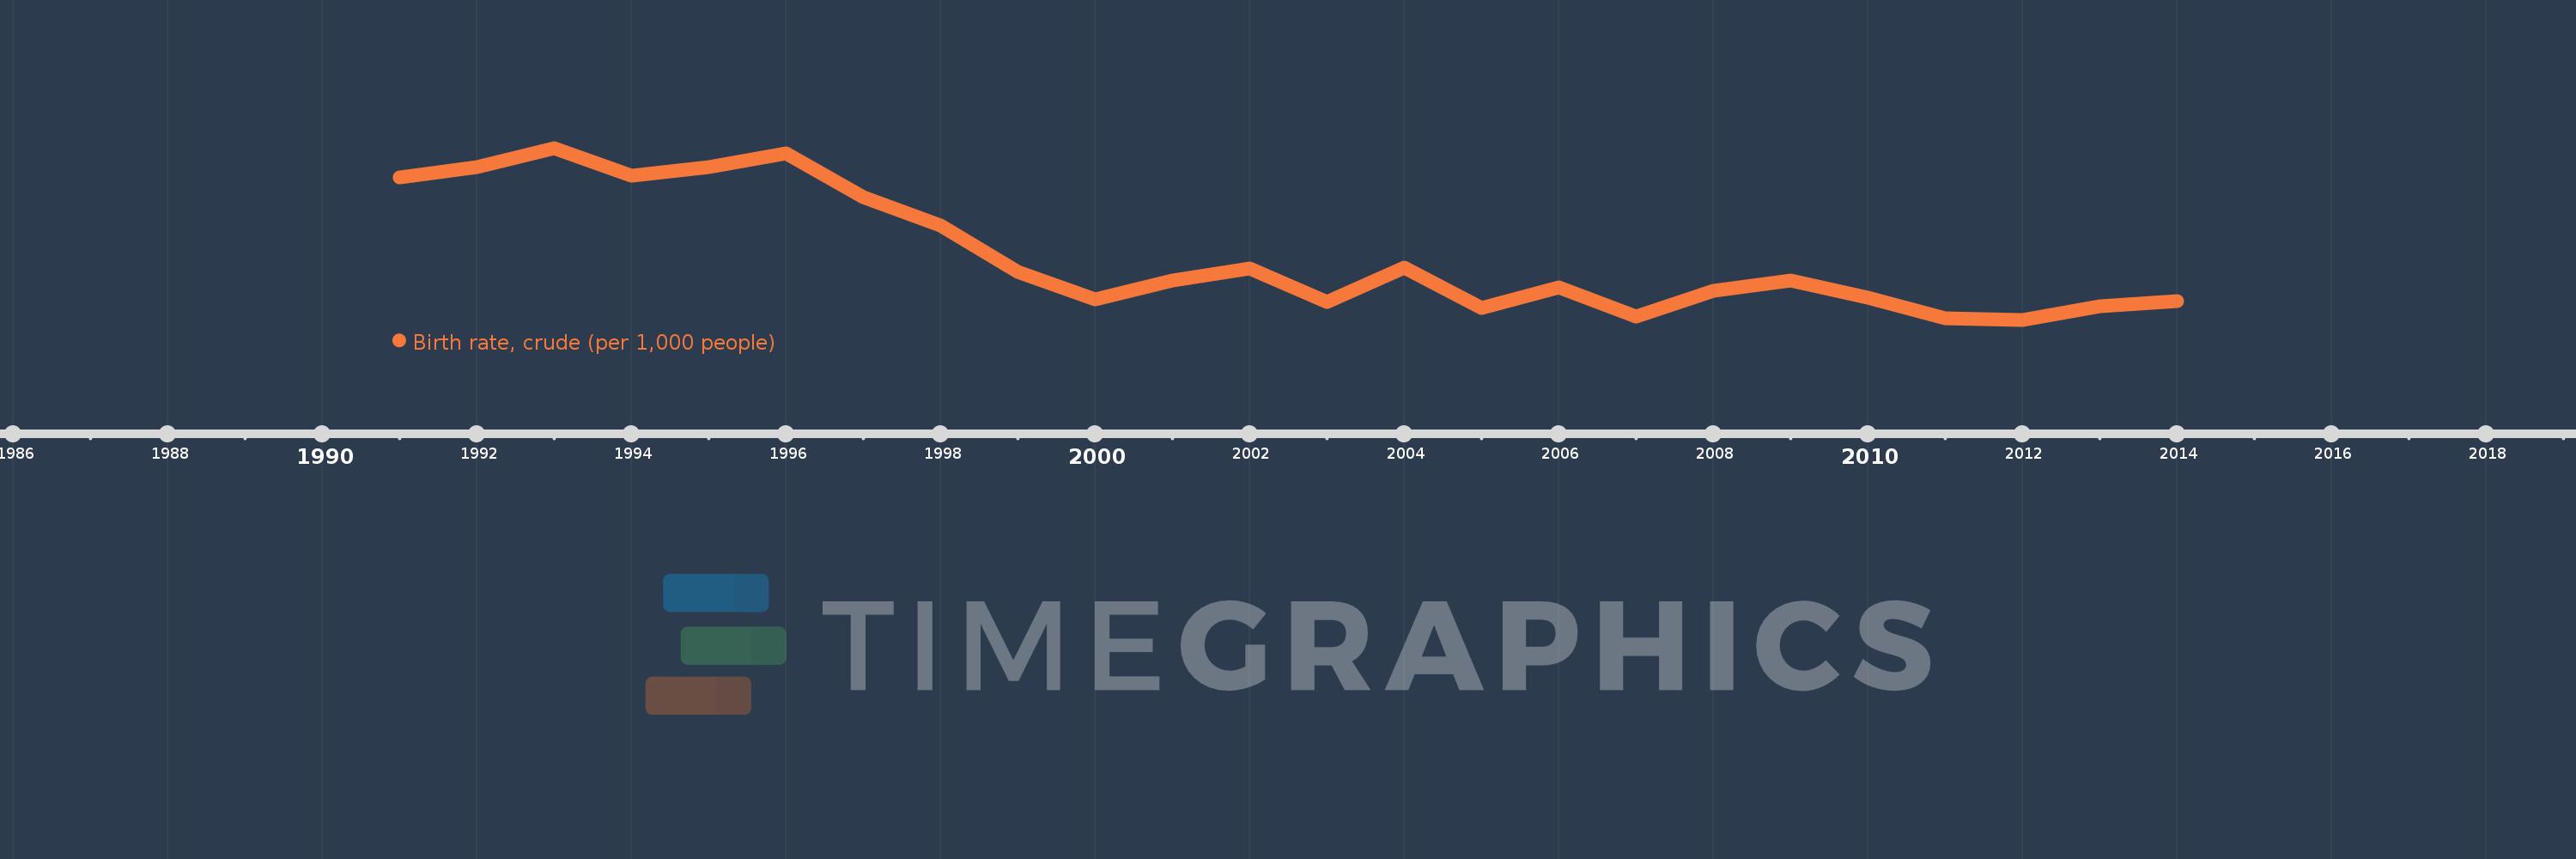
En esta escala de tiempo se presenta un gráfico de 1991 y 2014 de Palau. Los datos de 1990 están ausentes. El número de observaciones reales por fecha: 24.
Fuente (nombre):
Indicadores del desarrollo mundial
Fuente (organización):
(1) United Nations Population Division. World Population Prospects, (2) Census reports and other statistical publications from national statistical offices, (3) Eurostat: Demographic Statistics, (4) United Nations Statistical Division. Population and Vital Statistics Reprot (various years), (5) U.S. Census Bureau: International Database, and (6) Secretariat of the Pacific Community: Statistics and Demography Programme.
Categorías:
Health
Se ha actualizado:
23 abr 2017 año
Los indicadores de los cambios de valor en los últimos años
En promedio:
16.225
Mínimo:
11.8
1 ene 2012 año
Máximo:
23.6
1 ene 1993 año
A la fecha de observación
Valor
Cambio absoluto
El cambio con respecto al valor anterior
1 ene 1991 año
21.6
+21.6
0.0%
1 ene 1992 año
22.3
+0.7
3.24%
1 ene 1993 año
23.6
+1.3
5.83%
1 ene 1994 año
21.7
-1.9
-8.05%
1 ene 1995 año
22.3
+0.6
2.76%
1 ene 1996 año
23.2
+0.9
4.04%
1 ene 1997 año
20.2
-3.0
-12.93%
1 ene 1998 año
18.3
-1.9
-9.41%
1 ene 1999 año
15.1
-3.2
-17.49%
1 ene 2000 año
13.2
-1.9
-12.58%
1 ene 2001 año
14.5
+1.3
9.85%
1 ene 2002 año
15.3
+0.8
5.52%
1 ene 2003 año
13.0
-2.3
-15.03%
1 ene 2004 año
15.4
+2.4
18.46%
1 ene 2005 año
12.6
-2.8
-18.18%
1 ene 2006 año
14.0
+1.4
11.11%
1 ene 2007 año
12.0
-2.0
-14.29%
1 ene 2008 año
13.8
+1.8
15.0%
1 ene 2009 año
14.5
+0.7
5.07%
1 ene 2010 año
13.3
-1.2
-8.28%
1 ene 2011 año
11.9
-1.4
-10.53%
1 ene 2012 año
11.8
-0.1
-0.84%
1 ene 2013 año
12.7
+0.9
7.63%
1 ene 2014 año
13.1
+0.4
3.15%
Ranking de los países por los datos estadísticos actuales
