29
/es/
es
AIzaSyAYiBZKx7MnpbEhh9jyipgxe19OcubqV5w
April 1, 2024
55902
Pre-demographic dividend
PRE
false
2
1
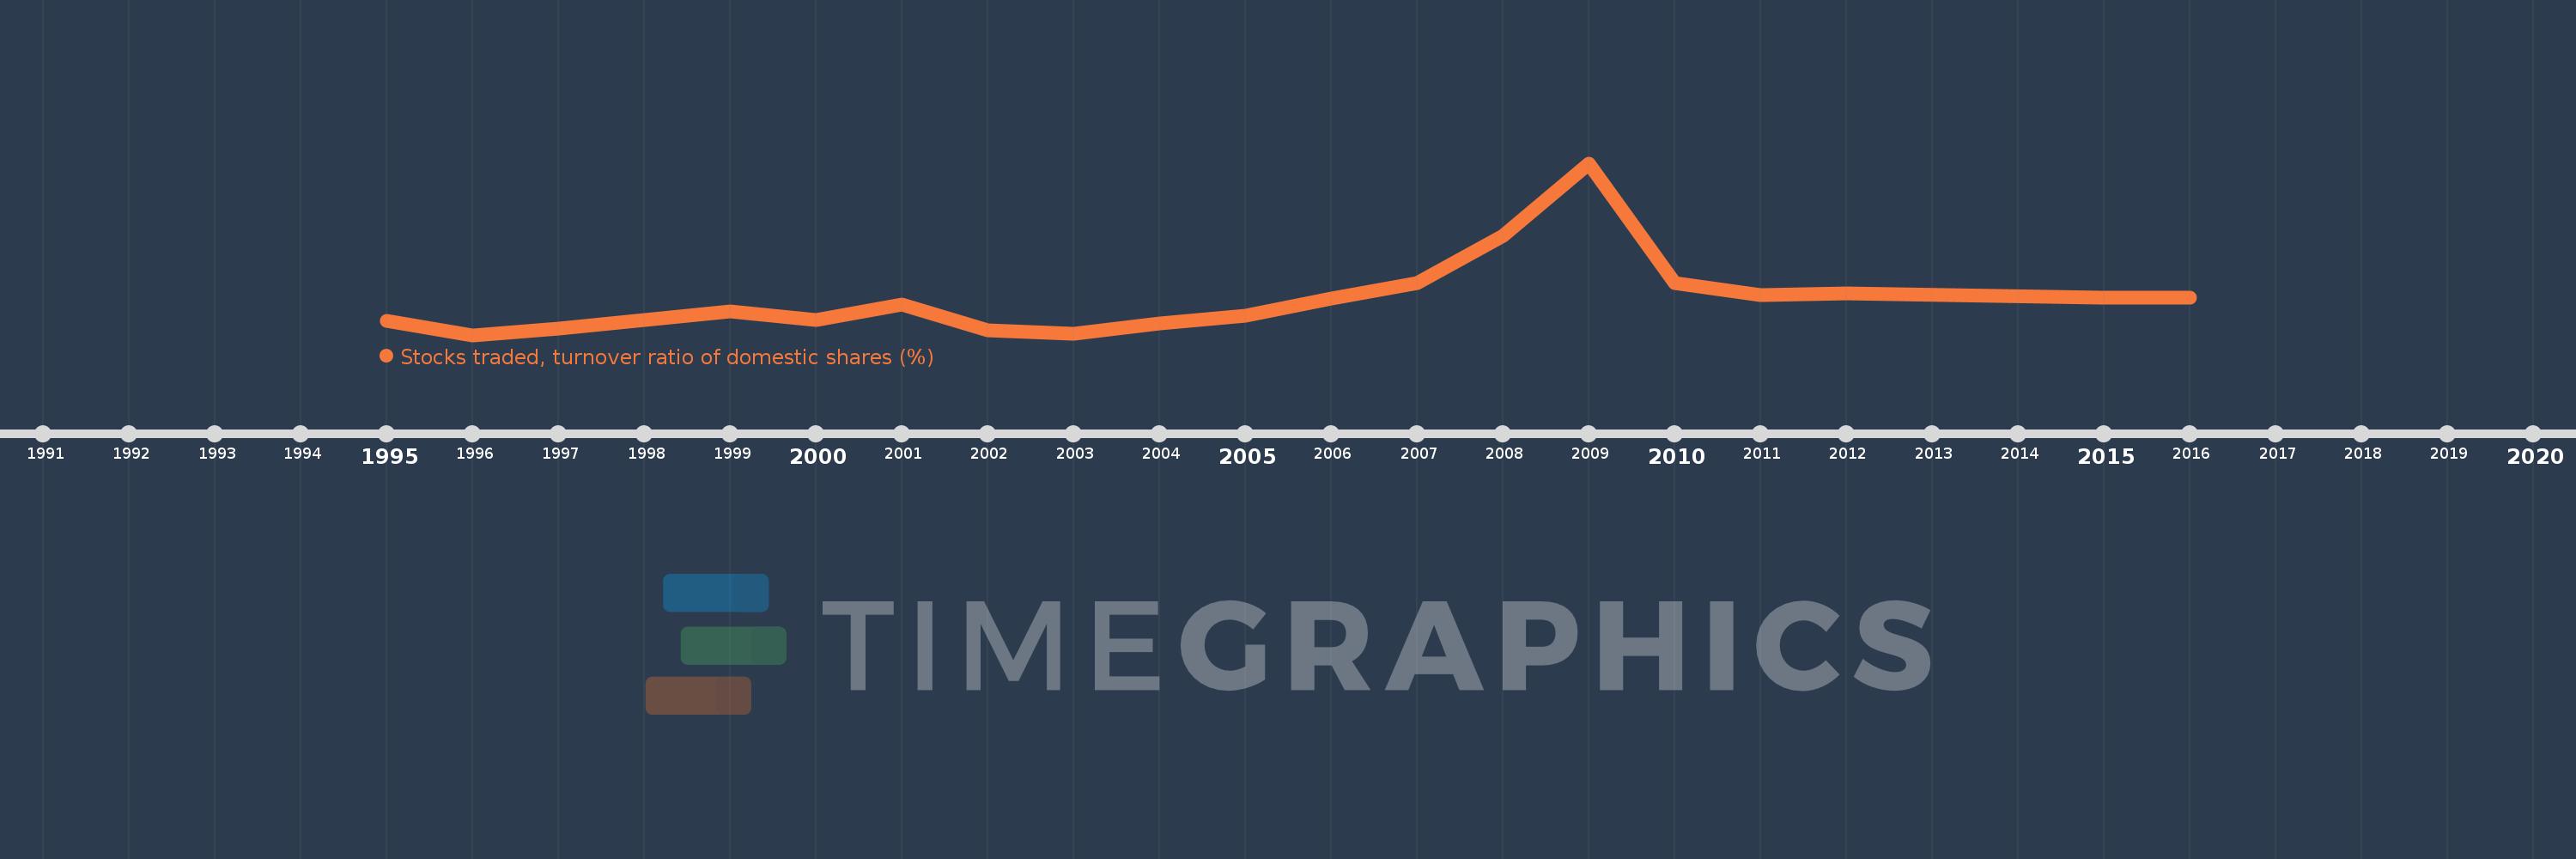
Stocks traded, turnover ratio of domestic shares (%)
2016,2015,2012,2011,2010,2009,2008,2007,2006,2005,2004,2003,2002,2001,2000,1999,1998,1997,1996,1995
Estas estadísticas en otros países:
línea de tiempo (timeline):
En esta escala de tiempo se presenta un gráfico de 1995 y 2016 de Pre-demographic dividend. Los datos de 1994 están ausentes. El número de observaciones reales por fecha: 20.
Fuente (nombre):
Indicadores del desarrollo mundial
Fuente (organización):
World Federation of Exchanges database.
Categorías:
Financial Sector
Se ha actualizado:
23 abr 2017 año
Los indicadores de los cambios de valor en los últimos años
Mínimo:
1.788
1 ene 1996 año
Máximo:
28.13
1 ene 2009 año
A la fecha de observación
Valor
Cambio absoluto
El cambio con respecto al valor anterior
1 ene 1995 año
3.932
+3.932
0.0%
1 ene 1996 año
1.788
-2.144
-54.53%
1 ene 1997 año
2.807
+1.019
57.01%
1 ene 1998 año
4.087
+1.28
45.58%
1 ene 1999 año
5.417
+1.33
32.54%
1 ene 2000 año
4.141
-1.276
-23.55%
1 ene 2001 año
6.524
+2.383
57.55%
1 ene 2002 año
2.533
-3.992
-61.18%
1 ene 2003 año
2.001
-0.531
-20.97%
1 ene 2004 año
3.598
+1.597
79.77%
1 ene 2005 año
4.757
+1.159
32.21%
1 ene 2006 año
7.411
+2.654
55.79%
1 ene 2007 año
9.781
+2.37
31.98%
1 ene 2008 año
17.048
+7.268
74.31%
1 ene 2009 año
28.13
+11.082
65.0%
1 ene 2010 año
9.711
-18.419
-65.48%
1 ene 2011 año
7.889
-1.822
-18.76%
1 ene 2012 año
8.211
+0.323
4.09%
1 ene 2015 año
7.508
-0.703
-8.56%
1 ene 2016 año
7.471
-0.037
-0.49%
Ranking de los países por los datos estadísticos actuales


Comentarios: