29
/es/
es
AIzaSyAYiBZKx7MnpbEhh9jyipgxe19OcubqV5w
April 1, 2024
202321
Morocco
MAR
true
2
1
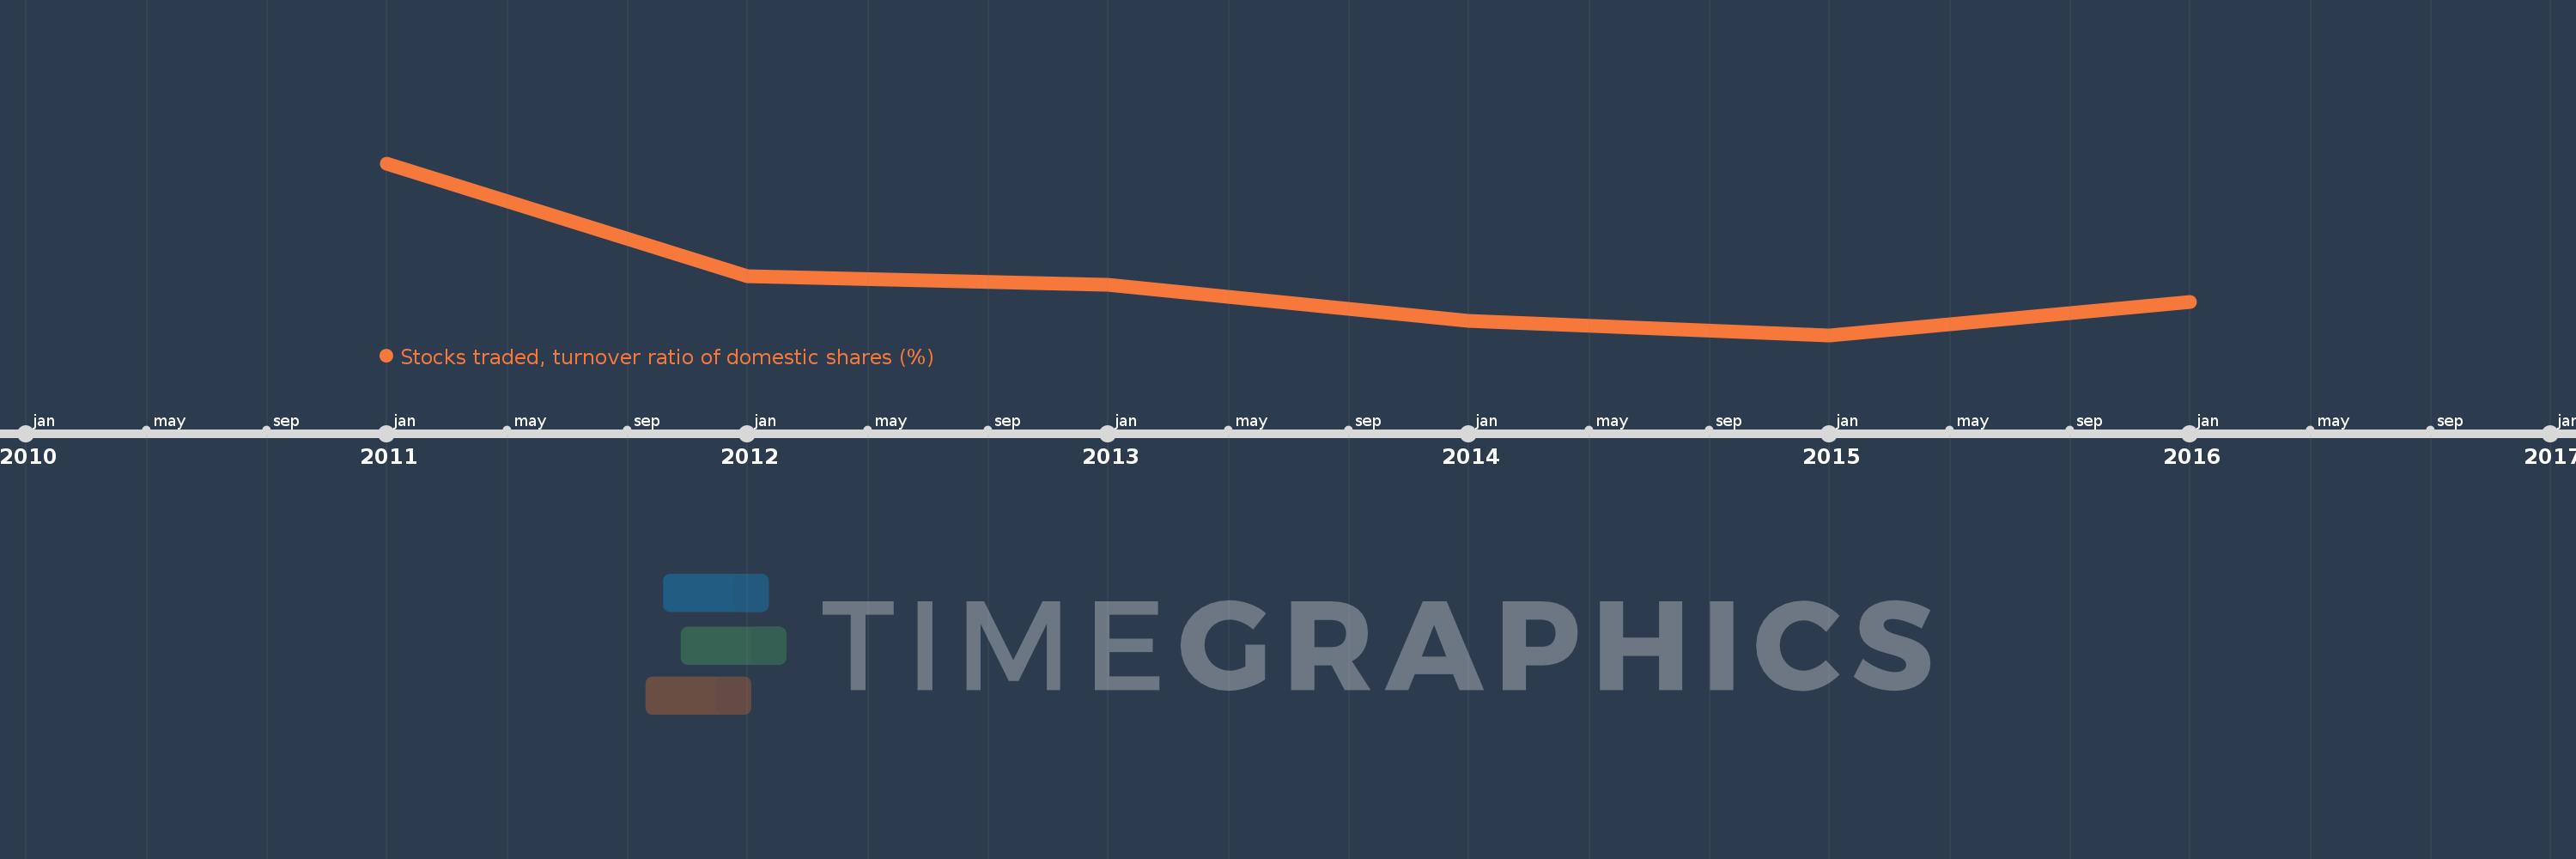
Stocks traded, turnover ratio of domestic shares (%)
2016,2015,2014,2013,2012,2011
Estas estadísticas en otros países:
línea de tiempo (timeline):
En esta escala de tiempo se presenta un gráfico de 2011 y 2016 de Morocco. Los datos de 2010 están ausentes. El número de observaciones reales por fecha: 6.
Fuente (nombre):
Indicadores del desarrollo mundial
Fuente (organización):
World Federation of Exchanges database.
Categorías:
Financial Sector
Se ha actualizado:
23 abr 2017 año
Los indicadores de los cambios de valor en los últimos años
Mínimo:
5.763
1 ene 2015 año
Máximo:
8.819
1 ene 2011 año
A la fecha de observación
Valor
Cambio absoluto
El cambio con respecto al valor anterior
1 ene 2011 año
8.819
+8.819
0.0%
1 ene 2012 año
6.811
-2.008
-22.77%
1 ene 2013 año
6.656
-0.155
-2.28%
1 ene 2014 año
6.013
-0.643
-9.66%
1 ene 2015 año
5.763
-0.25
-4.15%
1 ene 2016 año
6.356
+0.592
10.28%
Ranking de los países por los datos estadísticos actuales


Comentarios: