29
/es/
es
AIzaSyAYiBZKx7MnpbEhh9jyipgxe19OcubqV5w
April 1, 2024
172231
Kuwait
KWT
true
2
1
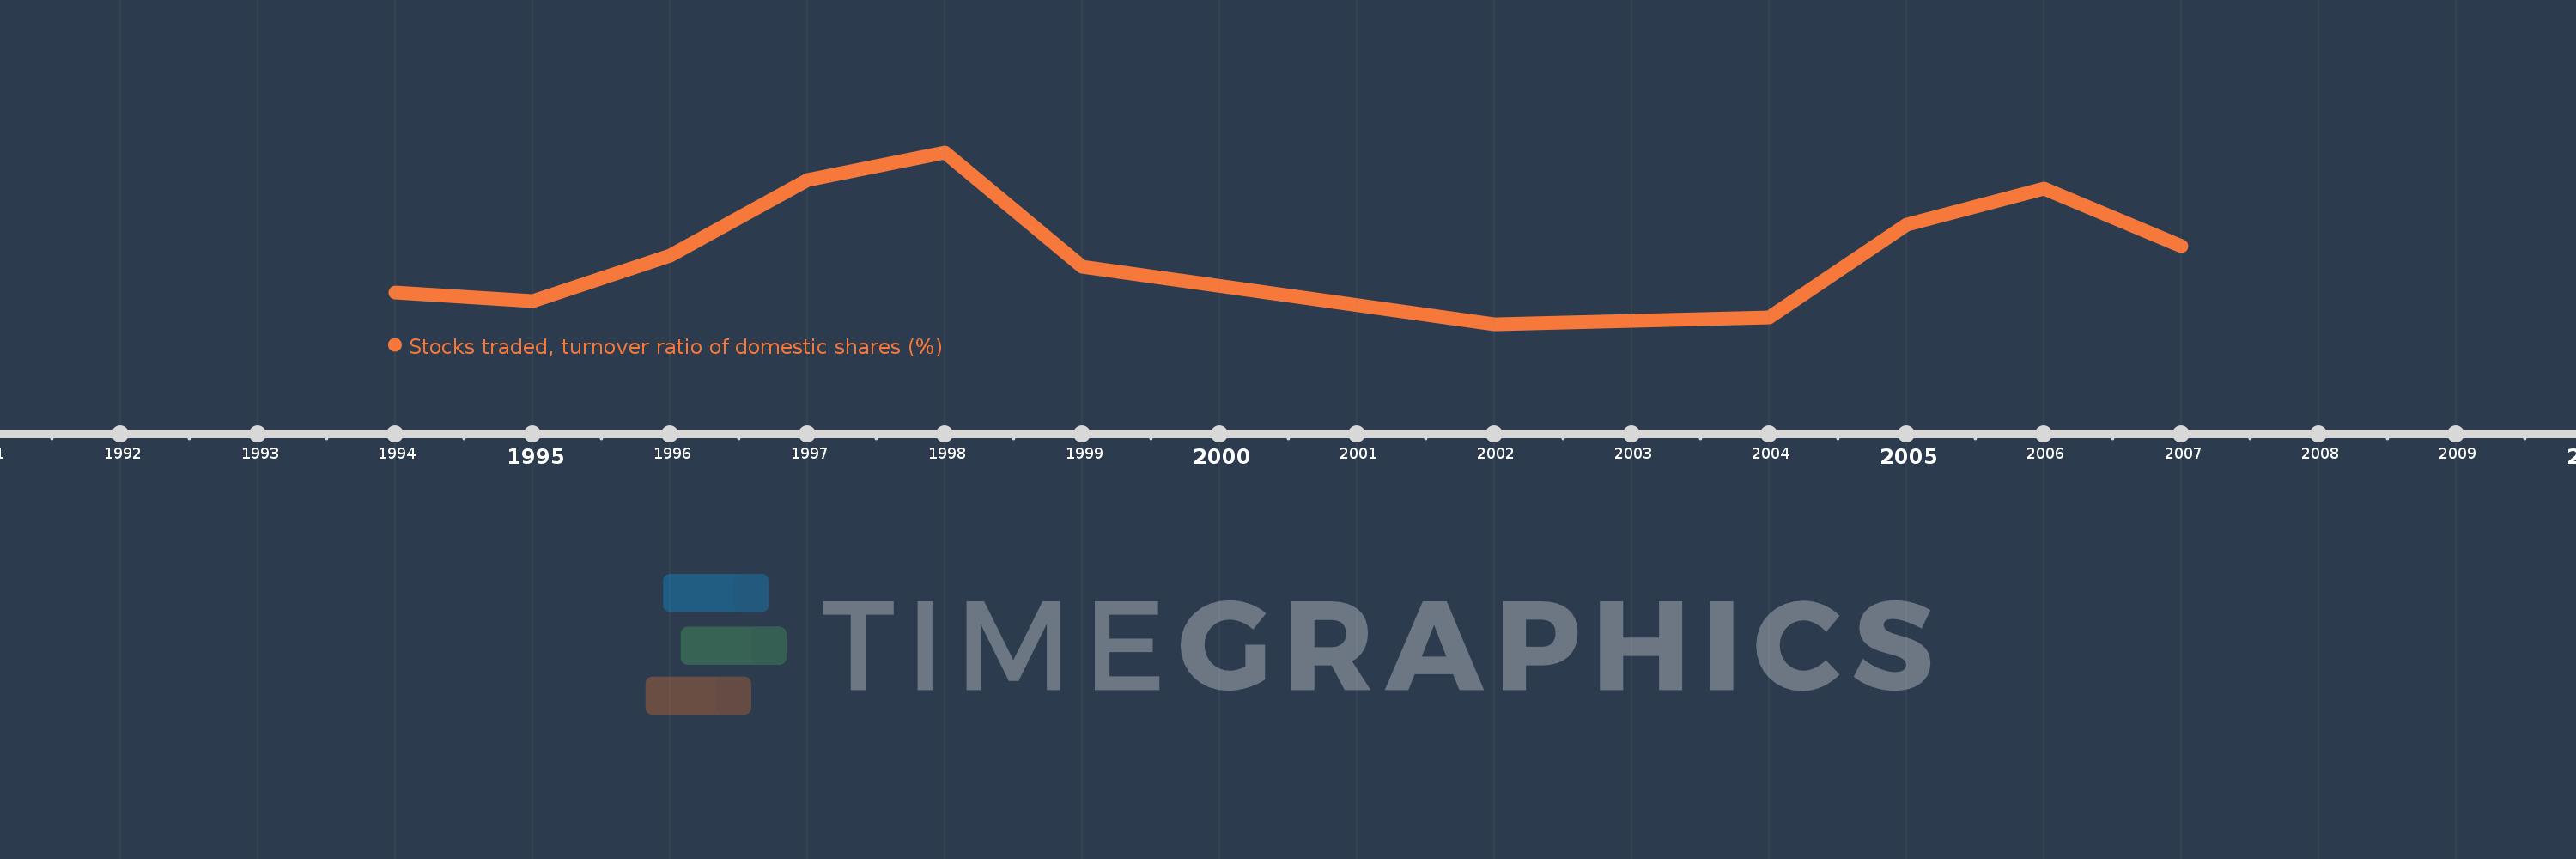
Stocks traded, turnover ratio of domestic shares (%)
2007,2006,2005,2004,2003,2002,1999,1998,1997,1996,1995,1994
Estas estadísticas en otros países:
línea de tiempo (timeline):
En esta escala de tiempo se presenta un gráfico de 1994 y 2007 de Kuwait. Los datos de 1993 están ausentes. El número de observaciones reales por fecha: 12.
Fuente (nombre):
Indicadores del desarrollo mundial
Fuente (organización):
World Federation of Exchanges database.
Categorías:
Financial Sector
Se ha actualizado:
23 abr 2017 año
Los indicadores de los cambios de valor en los últimos años
Mínimo:
5.149
1 ene 2002 año
Máximo:
111.229
1 ene 1998 año
A la fecha de observación
Valor
Cambio absoluto
El cambio con respecto al valor anterior
1 ene 1994 año
24.65
+24.65
0.0%
1 ene 1995 año
19.341
-5.309
-21.54%
1 ene 1996 año
47.597
+28.256
146.09%
1 ene 1997 año
93.961
+46.365
97.41%
1 ene 1998 año
111.229
+17.268
18.38%
1 ene 1999 año
40.722
-70.507
-63.39%
1 ene 2002 año
5.149
-35.573
-87.35%
1 ene 2003 año
7.088
+1.939
37.65%
1 ene 2004 año
9.204
+2.116
29.85%
1 ene 2005 año
66.464
+57.26
622.11%
1 ene 2006 año
89.055
+22.592
33.99%
1 ene 2007 año
53.423
-35.632
-40.01%
Ranking de los países por los datos estadísticos actuales


Comentarios: