29
/es/
es
AIzaSyAYiBZKx7MnpbEhh9jyipgxe19OcubqV5w
April 1, 2024
126938
El Salvador
SLV
true
2
1
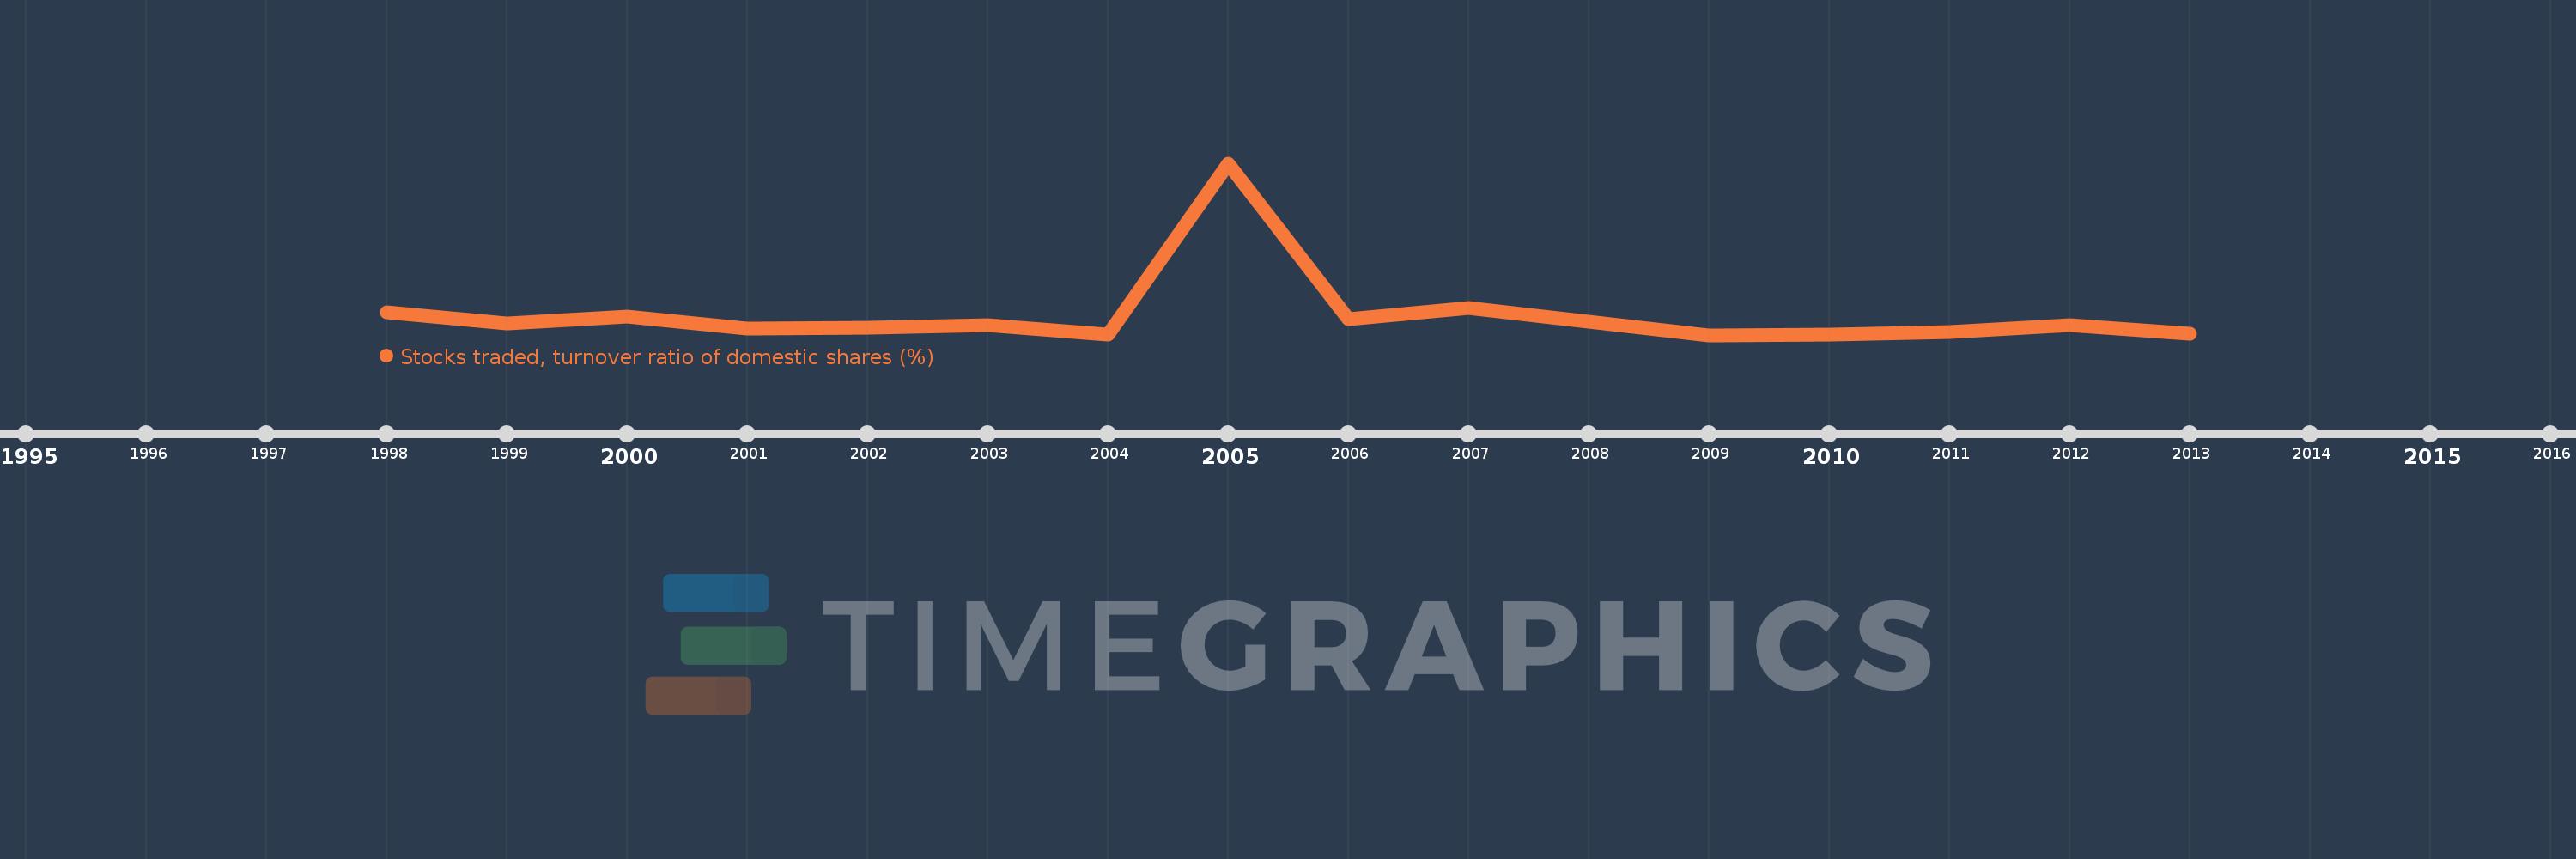
Stocks traded, turnover ratio of domestic shares (%)
2013,2012,2011,2010,2009,2007,2006,2005,2004,2003,2002,2001,2000,1999,1998
Estas estadísticas en otros países:
línea de tiempo (timeline):
En esta escala de tiempo se presenta un gráfico de 1998 y 2013 de El Salvador. Los datos de 1997 están ausentes. El número de observaciones reales por fecha: 15.
Fuente (nombre):
Indicadores del desarrollo mundial
Fuente (organización):
World Federation of Exchanges database.
Categorías:
Financial Sector
Se ha actualizado:
23 abr 2017 año
Los indicadores de los cambios de valor en los últimos años
Mínimo:
0.473
1 ene 2009 año
Máximo:
20.84
1 ene 2005 año
A la fecha de observación
Valor
Cambio absoluto
El cambio con respecto al valor anterior
1 ene 1998 año
3.155
+3.155
0.0%
1 ene 1999 año
1.861
-1.293
-40.99%
1 ene 2000 año
2.681
+0.82
44.03%
1 ene 2001 año
1.22
-1.461
-54.49%
1 ene 2002 año
1.375
+0.155
12.7%
1 ene 2003 año
1.681
+0.306
22.29%
1 ene 2004 año
0.567
-1.115
-66.3%
1 ene 2005 año
20.84
+20.274
3.58 mil%
1 ene 2006 año
2.33
-18.51
-88.82%
1 ene 2007 año
3.705
+1.375
59.02%
1 ene 2009 año
0.473
-3.232
-87.23%
1 ene 2010 año
0.546
+0.073
15.51%
1 ene 2011 año
0.785
+0.238
43.63%
1 ene 2012 año
1.6
+0.815
103.85%
1 ene 2013 año
0.645
-0.954
-59.65%
Ranking de los países por los datos estadísticos actuales


Comentarios: