29
/es/
es
AIzaSyAYiBZKx7MnpbEhh9jyipgxe19OcubqV5w
April 1, 2024
55877
Pre-demographic dividend
PRE
false
2
1
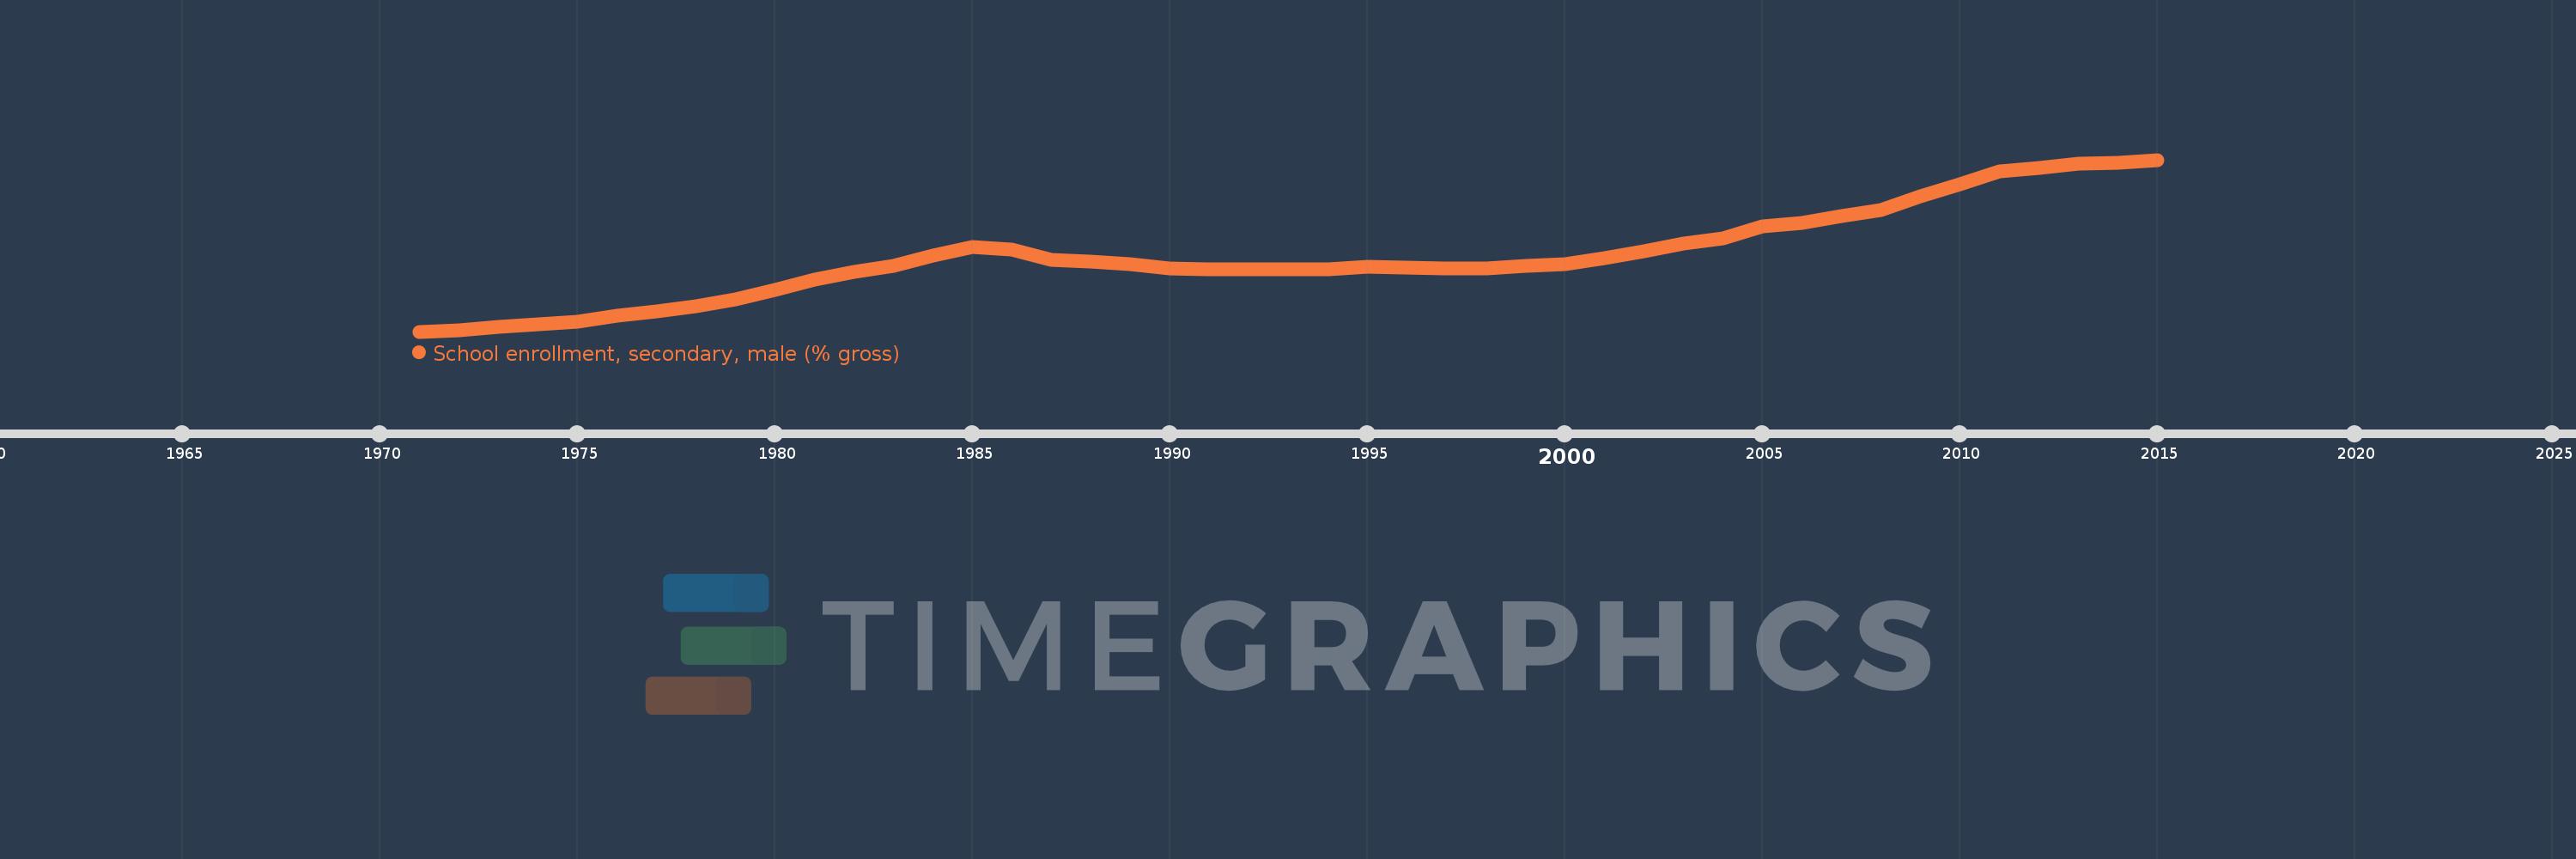
School enrollment, secondary, male (% gross)
2015,2014,2013,2012,2011,2010,2009,2008,2007,2006,2005,2004,2003,2002,2001,2000,1999,1998,1997,1996,1995,1994,1993,1992,1991,1990,1989,1988,1987,1986,1985,1984,1983,1982,1981,1980,1979,1978,1977,1976,1975,1974,1973,1972,1971
Estas estadísticas en otros países:
AfghanistanAlbaniaAlgeriaAndorraAngolaAntigua and BarbudaArab WorldArgentinaArmeniaArubaAustraliaAustriaAzerbaijanBahamas, TheBahrainBangladeshBarbadosBelarusBelgiumBelizeBeninBermudaBhutanBoliviaBosnia and HerzegovinaBotswanaBrazilBrunei DarussalamBulgariaBurkina FasoBurundiCabo VerdeCambodiaCameroonCanadaCaribbean small statesCentral African RepublicCentral Europe and the BalticsChadChileChinaColombiaComorosCongo, Dem. Rep.Congo, Rep.Costa RicaCote d'IvoireCroatiaCubaCuracaoCyprusCzech RepublicDenmarkDjiboutiDominicaDominican RepublicEarly-demographic dividendEast Asia & PacificEast Asia & Pacific (excluding high income)East Asia & Pacific (IDA & IBRD countries)EcuadorEgypt, Arab Rep.El SalvadorEquatorial GuineaEritreaEstoniaEthiopiaEuro areaEurope & Central AsiaEurope & Central Asia (excluding high income)Europe & Central Asia (IDA & IBRD countries)European UnionFijiFinlandFragile and conflict affected situationsFranceGabonGambia, TheGeorgiaGermanyGhanaGreeceGrenadaGuatemalaGuineaGuinea-BissauGuyanaHeavily indebted poor countries (HIPC)High incomeHondurasHong Kong SAR, ChinaHungaryIBRD onlyIcelandIDA & IBRD totalIDA blendIDA onlyIDA totalIndiaIndonesiaIran, Islamic Rep.IraqIrelandIsraelItalyJamaicaJapanJordanKazakhstanKenyaKiribatiKorea, Dem. People’s Rep.Korea, Rep.KuwaitKyrgyz RepublicLao PDRLate-demographic dividendLatin America & Caribbean Latin America & Caribbean (excluding high income)Latin America & the Caribbean (IDA & IBRD countries)LatviaLeast developed countries: UN classificationLebanonLesothoLiberiaLibyaLiechtensteinLithuaniaLow & middle incomeLow incomeLower middle incomeLuxembourgMacao SAR, ChinaMacedonia, FYRMadagascarMalawiMaldivesMaliMaltaMarshall IslandsMauritaniaMauritiusMexicoMicronesia, Fed. Sts.Middle East & North AfricaMiddle East & North Africa (excluding high income)Middle East & North Africa (IDA & IBRD countries)Middle incomeMoldovaMongoliaMontenegroMoroccoMozambiqueMyanmarNamibiaNauruNepalNetherlandsNew ZealandNicaraguaNigerNigeriaNorth AmericaNorwayOECD membersOmanOther small statesPacific island small statesPakistanPalauPanamaPapua New GuineaParaguayPeruPhilippinesPolandPortugalPost-demographic dividendPre-demographic dividendPuerto RicoQatarRomaniaRussian FederationRwandaSamoaSan MarinoSao Tome and PrincipeSaudi ArabiaSenegalSerbiaSeychellesSierra LeoneSlovak RepublicSloveniaSmall statesSolomon IslandsSomaliaSouth AfricaSouth AsiaSouth Asia (IDA & IBRD)SpainSri LankaSt. Kitts and NevisSt. LuciaSt. Vincent and the GrenadinesSub-Saharan Africa Sub-Saharan Africa (excluding high income)Sub-Saharan Africa (IDA & IBRD countries)SudanSurinameSwazilandSwedenSwitzerlandSyrian Arab RepublicTajikistanTanzaniaThailandTimor-LesteTogoTongaTrinidad and TobagoTunisiaTurkeyTurkmenistanTuvaluUgandaUkraineUnited Arab EmiratesUnited KingdomUnited StatesUpper middle incomeUruguayUzbekistanVanuatuVenezuela, RBVietnamWest Bank and GazaWorldYemen, Rep.ZambiaZimbabwe línea de tiempo (timeline):
En esta escala de tiempo se presenta un gráfico de 1971 y 2015 de Pre-demographic dividend. Los datos de 1970 están ausentes. El número de observaciones reales por fecha: 45.
Fuente (nombre):
Indicadores del desarrollo mundial
Fuente (organización):
United Nations Educational, Scientific, and Cultural Organization (UNESCO) Institute for Statistics.
Categorías:
Education, Gender
Se ha actualizado:
23 abr 2017 año
Los indicadores de los cambios de valor en los últimos años
Mínimo:
12.959
1 ene 1971 año
Máximo:
45.715
1 ene 2015 año
A la fecha de observación
Valor
Cambio absoluto
El cambio con respecto al valor anterior
1 ene 1971 año
12.959
+12.959
0.0%
1 ene 1972 año
13.135
+0.176
1.36%
1 ene 1973 año
13.798
+0.663
5.05%
1 ene 1974 año
14.388
+0.59
4.28%
1 ene 1975 año
14.857
+0.469
3.26%
1 ene 1976 año
15.937
+1.079
7.27%
1 ene 1977 año
16.809
+0.873
5.48%
1 ene 1978 año
17.728
+0.918
5.46%
1 ene 1979 año
19.173
+1.445
8.15%
1 ene 1980 año
20.916
+1.744
9.1%
1 ene 1981 año
22.83
+1.913
9.15%
1 ene 1982 año
24.321
+1.491
6.53%
1 ene 1983 año
25.451
+1.129
4.64%
1 ene 1984 año
27.382
+1.931
7.59%
1 ene 1985 año
29.076
+1.695
6.19%
1 ene 1986 año
28.603
-0.474
-1.63%
1 ene 1987 año
26.7
-1.902
-6.65%
1 ene 1988 año
26.332
-0.368
-1.38%
1 ene 1989 año
25.811
-0.521
-1.98%
1 ene 1990 año
24.97
-0.841
-3.26%
1 ene 1991 año
24.856
-0.114
-0.46%
1 ene 1992 año
24.86
+0.005
0.02%
1 ene 1993 año
24.787
-0.073
-0.3%
1 ene 1994 año
24.809
+0.022
0.09%
1 ene 1995 año
25.244
+0.435
1.75%
1 ene 1996 año
25.208
-0.036
-0.14%
1 ene 1997 año
25.072
-0.136
-0.54%
1 ene 1998 año
25.039
-0.033
-0.13%
1 ene 1999 año
25.484
+0.445
1.78%
1 ene 2000 año
25.798
+0.314
1.23%
1 ene 2001 año
26.922
+1.124
4.36%
1 ene 2002 año
28.306
+1.384
5.14%
1 ene 2003 año
29.703
+1.397
4.94%
1 ene 2004 año
30.804
+1.1
3.7%
1 ene 2005 año
33.07
+2.266
7.36%
1 ene 2006 año
33.696
+0.626
1.89%
1 ene 2007 año
35.007
+1.311
3.89%
1 ene 2008 año
36.063
+1.057
3.02%
1 ene 2009 año
38.772
+2.709
7.51%
1 ene 2010 año
41.121
+2.349
6.06%
1 ene 2011 año
43.46
+2.339
5.69%
1 ene 2012 año
44.223
+0.763
1.76%
1 ene 2013 año
44.992
+0.768
1.74%
1 ene 2014 año
45.087
+0.095
0.21%
1 ene 2015 año
45.715
+0.628
1.39%
Ranking de los países por los datos estadísticos actuales


Comentarios: