29
/es/
es
AIzaSyAYiBZKx7MnpbEhh9jyipgxe19OcubqV5w
April 1, 2024
106629
China
CHN
true
2
1
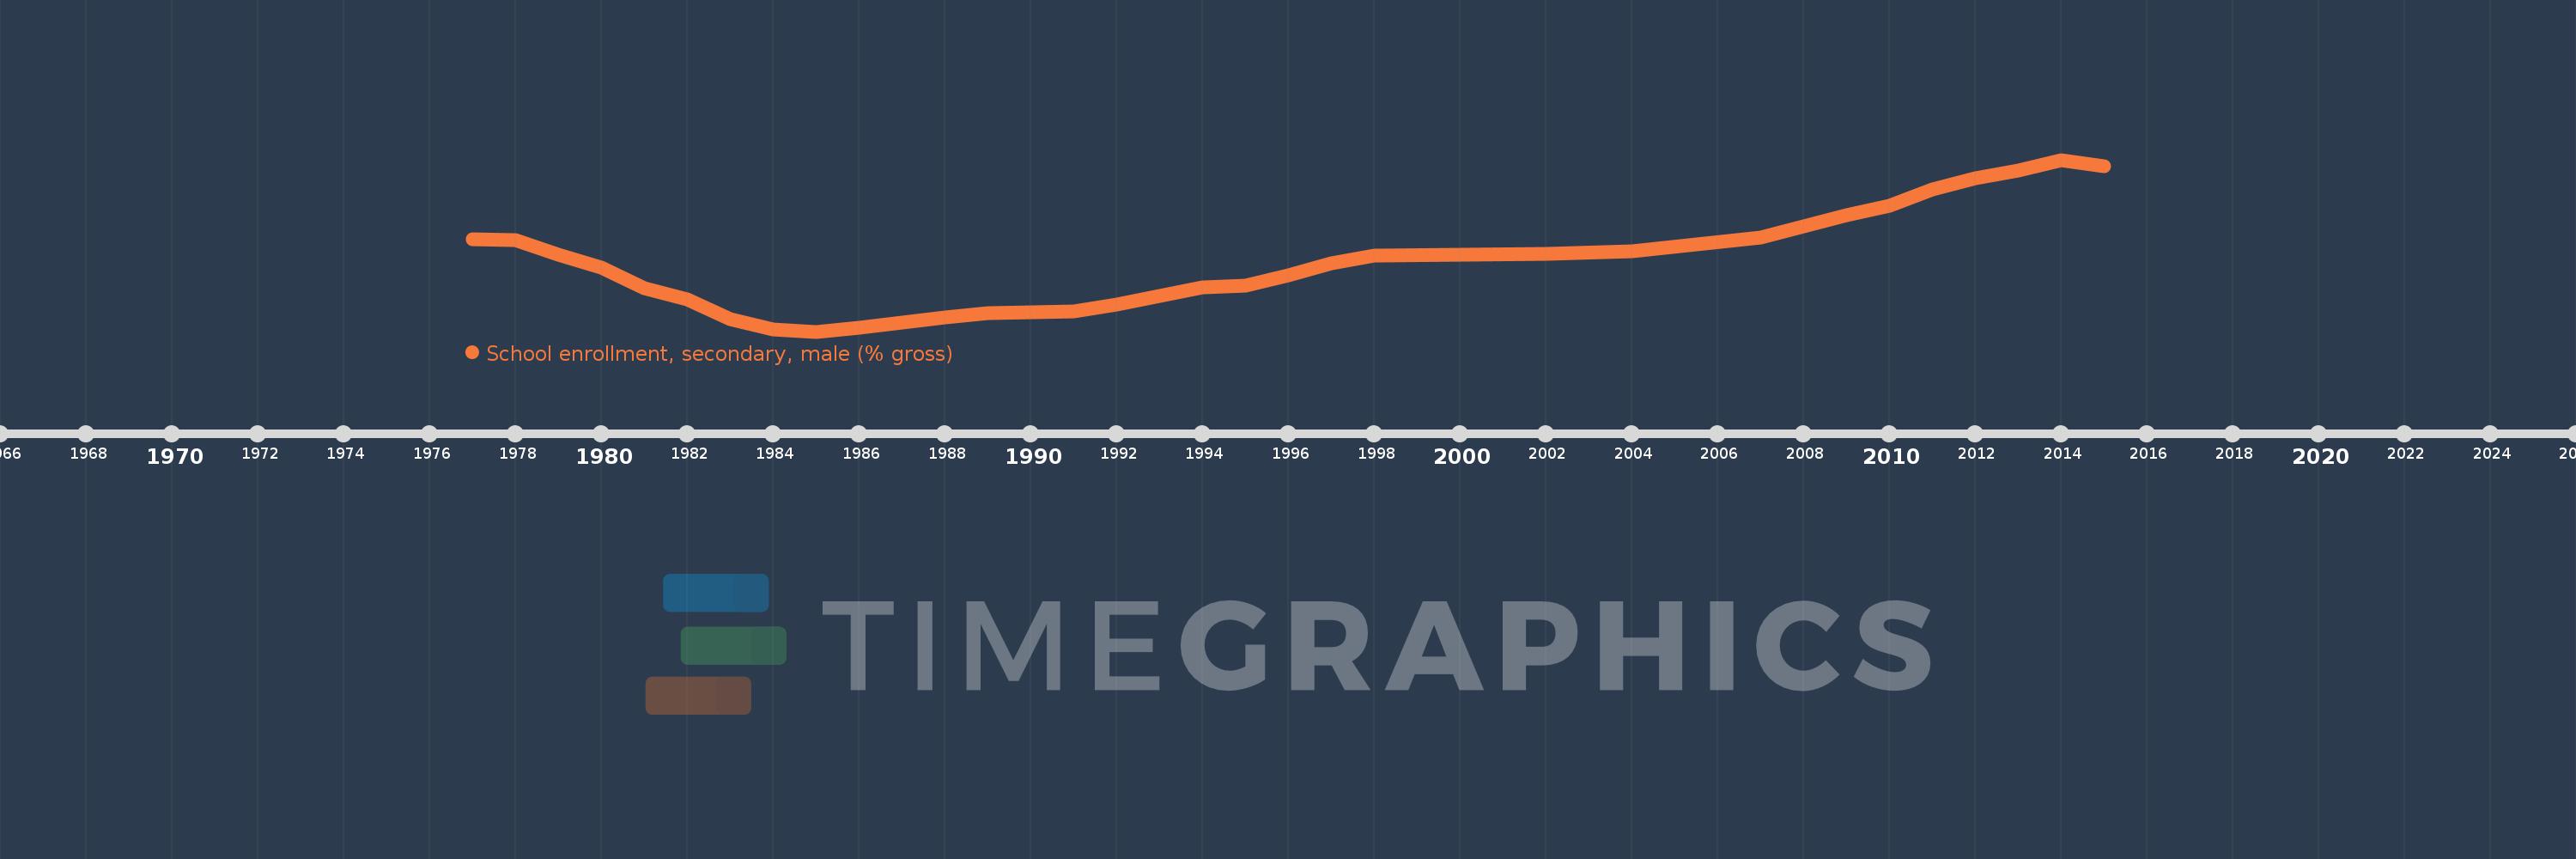
School enrollment, secondary, male (% gross)
2015,2014,2013,2012,2011,2010,2009,2008,2007,2004,2002,1998,1997,1996,1995,1994,1993,1992,1991,1990,1989,1988,1987,1986,1985,1984,1983,1982,1981,1980,1979,1978,1977
Estas estadísticas en otros países:
AfghanistanAlbaniaAlgeriaAndorraAngolaAntigua and BarbudaArab WorldArgentinaArmeniaArubaAustraliaAustriaAzerbaijanBahamas, TheBahrainBangladeshBarbadosBelarusBelgiumBelizeBeninBermudaBhutanBoliviaBosnia and HerzegovinaBotswanaBrazilBrunei DarussalamBulgariaBurkina FasoBurundiCabo VerdeCambodiaCameroonCanadaCaribbean small statesCentral African RepublicCentral Europe and the BalticsChadChileChinaColombiaComorosCongo, Dem. Rep.Congo, Rep.Costa RicaCote d'IvoireCroatiaCubaCuracaoCyprusCzech RepublicDenmarkDjiboutiDominicaDominican RepublicEarly-demographic dividendEast Asia & PacificEast Asia & Pacific (excluding high income)East Asia & Pacific (IDA & IBRD countries)EcuadorEgypt, Arab Rep.El SalvadorEquatorial GuineaEritreaEstoniaEthiopiaEuro areaEurope & Central AsiaEurope & Central Asia (excluding high income)Europe & Central Asia (IDA & IBRD countries)European UnionFijiFinlandFragile and conflict affected situationsFranceGabonGambia, TheGeorgiaGermanyGhanaGreeceGrenadaGuatemalaGuineaGuinea-BissauGuyanaHeavily indebted poor countries (HIPC)High incomeHondurasHong Kong SAR, ChinaHungaryIBRD onlyIcelandIDA & IBRD totalIDA blendIDA onlyIDA totalIndiaIndonesiaIran, Islamic Rep.IraqIrelandIsraelItalyJamaicaJapanJordanKazakhstanKenyaKiribatiKorea, Dem. People’s Rep.Korea, Rep.KuwaitKyrgyz RepublicLao PDRLate-demographic dividendLatin America & Caribbean Latin America & Caribbean (excluding high income)Latin America & the Caribbean (IDA & IBRD countries)LatviaLeast developed countries: UN classificationLebanonLesothoLiberiaLibyaLiechtensteinLithuaniaLow & middle incomeLow incomeLower middle incomeLuxembourgMacao SAR, ChinaMacedonia, FYRMadagascarMalawiMaldivesMaliMaltaMarshall IslandsMauritaniaMauritiusMexicoMicronesia, Fed. Sts.Middle East & North AfricaMiddle East & North Africa (excluding high income)Middle East & North Africa (IDA & IBRD countries)Middle incomeMoldovaMongoliaMontenegroMoroccoMozambiqueMyanmarNamibiaNauruNepalNetherlandsNew ZealandNicaraguaNigerNigeriaNorth AmericaNorwayOECD membersOmanOther small statesPacific island small statesPakistanPalauPanamaPapua New GuineaParaguayPeruPhilippinesPolandPortugalPost-demographic dividendPre-demographic dividendPuerto RicoQatarRomaniaRussian FederationRwandaSamoaSan MarinoSao Tome and PrincipeSaudi ArabiaSenegalSerbiaSeychellesSierra LeoneSlovak RepublicSloveniaSmall statesSolomon IslandsSomaliaSouth AfricaSouth AsiaSouth Asia (IDA & IBRD)SpainSri LankaSt. Kitts and NevisSt. LuciaSt. Vincent and the GrenadinesSub-Saharan Africa Sub-Saharan Africa (excluding high income)Sub-Saharan Africa (IDA & IBRD countries)SudanSurinameSwazilandSwedenSwitzerlandSyrian Arab RepublicTajikistanTanzaniaThailandTimor-LesteTogoTongaTrinidad and TobagoTunisiaTurkeyTurkmenistanTuvaluUgandaUkraineUnited Arab EmiratesUnited KingdomUnited StatesUpper middle incomeUruguayUzbekistanVanuatuVenezuela, RBVietnamWest Bank and GazaWorldYemen, Rep.ZambiaZimbabwe línea de tiempo (timeline):
En esta escala de tiempo se presenta un gráfico de 1977 y 2015 de China. Los datos de 1976 están ausentes. El número de observaciones reales por fecha: 33.
Fuente (nombre):
Indicadores del desarrollo mundial
Fuente (organización):
United Nations Educational, Scientific, and Cultural Organization (UNESCO) Institute for Statistics.
Categorías:
Education, Gender
Se ha actualizado:
23 abr 2017 año
Los indicadores de los cambios de valor en los últimos años
Mínimo:
35.729
1 ene 1985 año
Máximo:
95.446
1 ene 2014 año
A la fecha de observación
Valor
Cambio absoluto
El cambio con respecto al valor anterior
1 ene 1977 año
67.84
+67.84
0.0%
1 ene 1978 año
67.634
-0.206
-0.3%
1 ene 1979 año
62.393
-5.24
-7.75%
1 ene 1980 año
57.927
-4.466
-7.16%
1 ene 1981 año
50.855
-7.072
-12.21%
1 ene 1982 año
46.898
-3.957
-7.78%
1 ene 1983 año
40.195
-6.702
-14.29%
1 ene 1984 año
36.589
-3.606
-8.97%
1 ene 1985 año
35.729
-0.86
-2.35%
1 ene 1986 año
36.924
+1.195
3.34%
1 ene 1987 año
38.886
+1.962
5.31%
1 ene 1988 año
40.631
+1.745
4.49%
1 ene 1989 año
42.277
+1.646
4.05%
1 ene 1990 año
42.335
+0.058
0.14%
1 ene 1991 año
42.779
+0.444
1.05%
1 ene 1992 año
45.083
+2.304
5.39%
1 ene 1993 año
48.084
+3.001
6.66%
1 ene 1994 año
50.993
+2.909
6.05%
1 ene 1995 año
51.654
+0.662
1.3%
1 ene 1996 año
55.156
+3.501
6.78%
1 ene 1997 año
59.363
+4.207
7.63%
1 ene 1998 año
62.04
+2.677
4.51%
1 ene 2002 año
62.706
+0.666
1.07%
1 ene 2004 año
63.745
+1.04
1.66%
1 ene 2007 año
68.494
+4.749
7.45%
1 ene 2008 año
72.394
+3.9
5.69%
1 ene 2009 año
76.1
+3.706
5.12%
1 ene 2010 año
79.565
+3.465
4.55%
1 ene 2011 año
85.043
+5.478
6.88%
1 ene 2012 año
89.012
+3.97
4.67%
1 ene 2013 año
91.799
+2.787
3.13%
1 ene 2014 año
95.446
+3.647
3.97%
1 ene 2015 año
93.353
-2.093
-2.19%
Ranking de los países por los datos estadísticos actuales


Comentarios: