29
/es/
es
AIzaSyAYiBZKx7MnpbEhh9jyipgxe19OcubqV5w
April 1, 2024
116228
Cuba
CUB
true
2
1
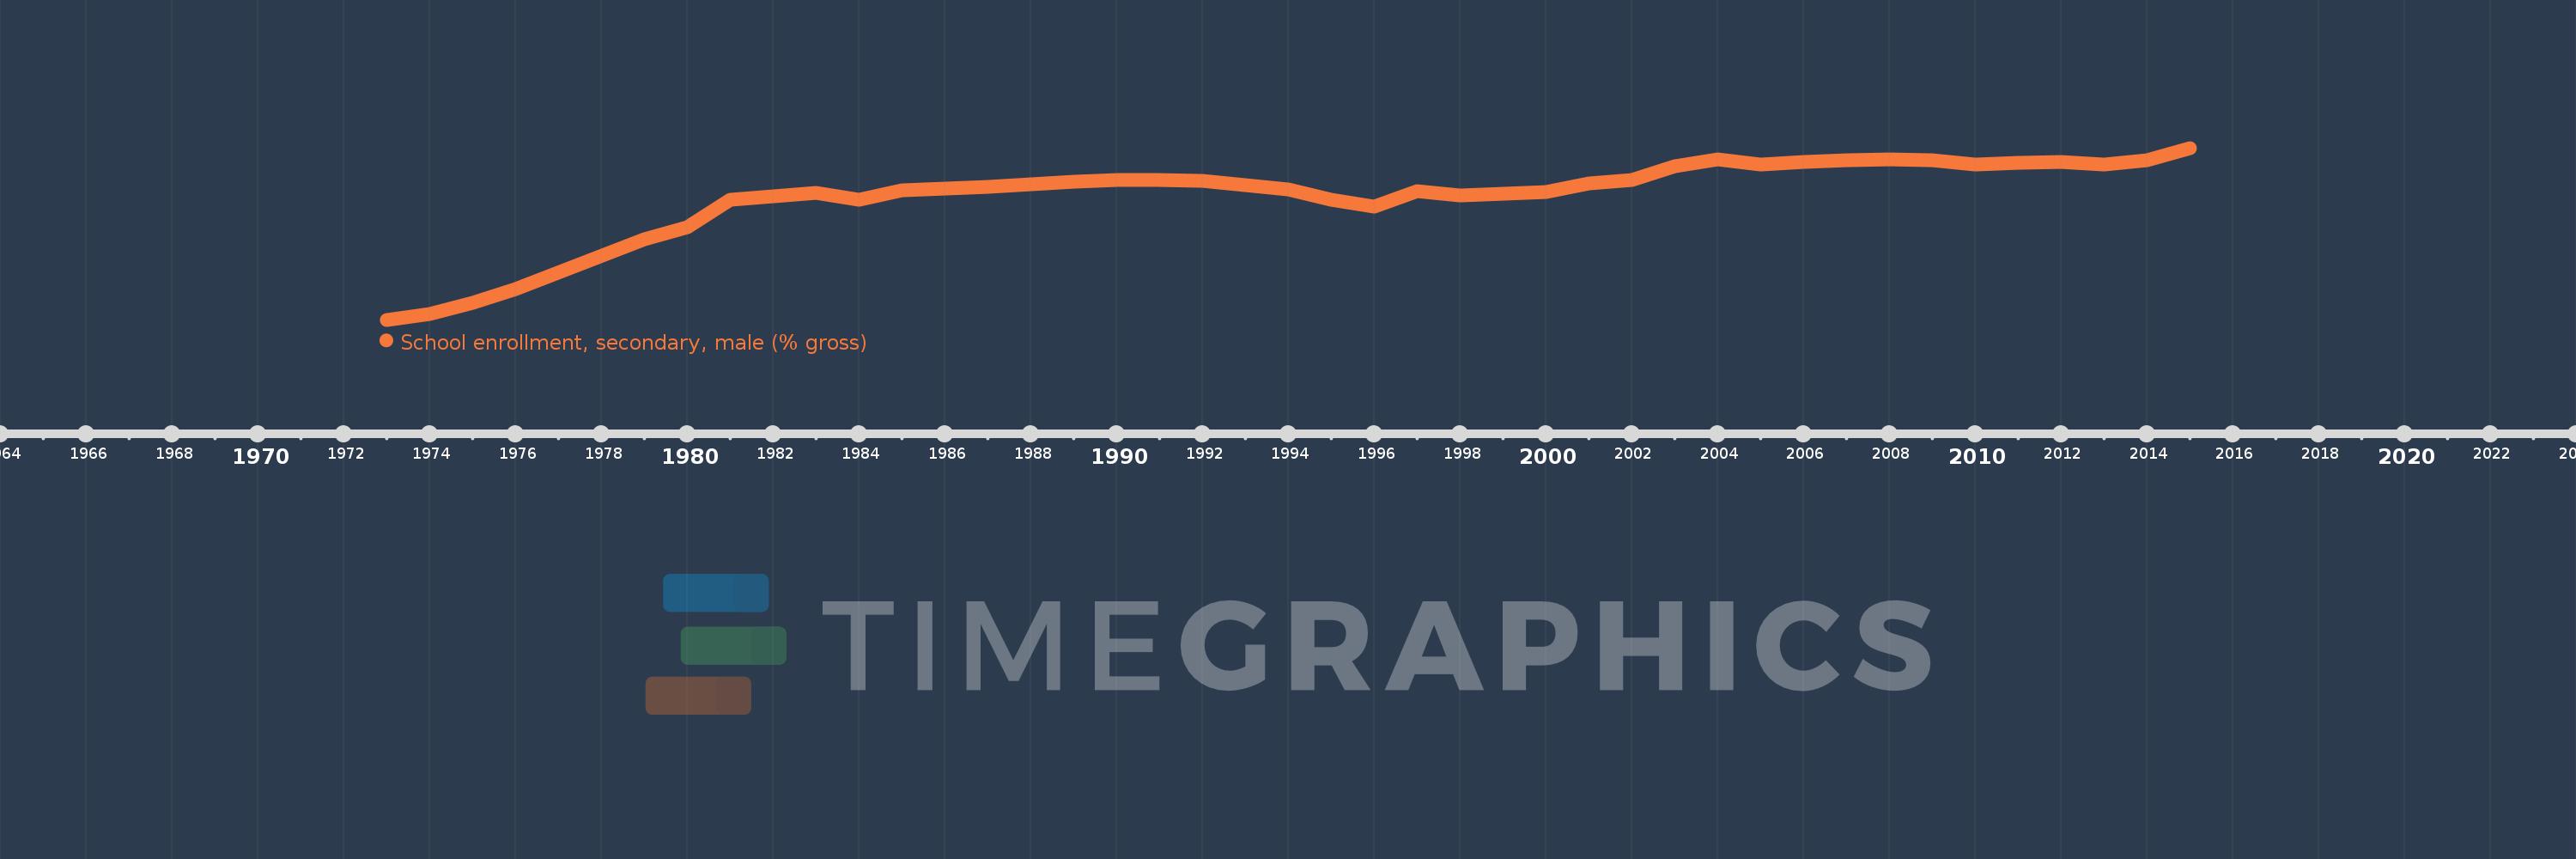
School enrollment, secondary, male (% gross)
2015,2014,2013,2012,2011,2010,2009,2008,2007,2006,2005,2004,2003,2002,2001,2000,1998,1997,1996,1995,1994,1993,1992,1991,1990,1989,1988,1987,1986,1985,1984,1983,1982,1981,1980,1979,1976,1975,1974,1973
Estas estadísticas en otros países:
AfghanistanAlbaniaAlgeriaAndorraAngolaAntigua and BarbudaArab WorldArgentinaArmeniaArubaAustraliaAustriaAzerbaijanBahamas, TheBahrainBangladeshBarbadosBelarusBelgiumBelizeBeninBermudaBhutanBoliviaBosnia and HerzegovinaBotswanaBrazilBrunei DarussalamBulgariaBurkina FasoBurundiCabo VerdeCambodiaCameroonCanadaCaribbean small statesCentral African RepublicCentral Europe and the BalticsChadChileChinaColombiaComorosCongo, Dem. Rep.Congo, Rep.Costa RicaCote d'IvoireCroatiaCubaCuracaoCyprusCzech RepublicDenmarkDjiboutiDominicaDominican RepublicEarly-demographic dividendEast Asia & PacificEast Asia & Pacific (excluding high income)East Asia & Pacific (IDA & IBRD countries)EcuadorEgypt, Arab Rep.El SalvadorEquatorial GuineaEritreaEstoniaEthiopiaEuro areaEurope & Central AsiaEurope & Central Asia (excluding high income)Europe & Central Asia (IDA & IBRD countries)European UnionFijiFinlandFragile and conflict affected situationsFranceGabonGambia, TheGeorgiaGermanyGhanaGreeceGrenadaGuatemalaGuineaGuinea-BissauGuyanaHeavily indebted poor countries (HIPC)High incomeHondurasHong Kong SAR, ChinaHungaryIBRD onlyIcelandIDA & IBRD totalIDA blendIDA onlyIDA totalIndiaIndonesiaIran, Islamic Rep.IraqIrelandIsraelItalyJamaicaJapanJordanKazakhstanKenyaKiribatiKorea, Dem. People’s Rep.Korea, Rep.KuwaitKyrgyz RepublicLao PDRLate-demographic dividendLatin America & Caribbean Latin America & Caribbean (excluding high income)Latin America & the Caribbean (IDA & IBRD countries)LatviaLeast developed countries: UN classificationLebanonLesothoLiberiaLibyaLiechtensteinLithuaniaLow & middle incomeLow incomeLower middle incomeLuxembourgMacao SAR, ChinaMacedonia, FYRMadagascarMalawiMaldivesMaliMaltaMarshall IslandsMauritaniaMauritiusMexicoMicronesia, Fed. Sts.Middle East & North AfricaMiddle East & North Africa (excluding high income)Middle East & North Africa (IDA & IBRD countries)Middle incomeMoldovaMongoliaMontenegroMoroccoMozambiqueMyanmarNamibiaNauruNepalNetherlandsNew ZealandNicaraguaNigerNigeriaNorth AmericaNorwayOECD membersOmanOther small statesPacific island small statesPakistanPalauPanamaPapua New GuineaParaguayPeruPhilippinesPolandPortugalPost-demographic dividendPre-demographic dividendPuerto RicoQatarRomaniaRussian FederationRwandaSamoaSan MarinoSao Tome and PrincipeSaudi ArabiaSenegalSerbiaSeychellesSierra LeoneSlovak RepublicSloveniaSmall statesSolomon IslandsSomaliaSouth AfricaSouth AsiaSouth Asia (IDA & IBRD)SpainSri LankaSt. Kitts and NevisSt. LuciaSt. Vincent and the GrenadinesSub-Saharan Africa Sub-Saharan Africa (excluding high income)Sub-Saharan Africa (IDA & IBRD countries)SudanSurinameSwazilandSwedenSwitzerlandSyrian Arab RepublicTajikistanTanzaniaThailandTimor-LesteTogoTongaTrinidad and TobagoTunisiaTurkeyTurkmenistanTuvaluUgandaUkraineUnited Arab EmiratesUnited KingdomUnited StatesUpper middle incomeUruguayUzbekistanVanuatuVenezuela, RBVietnamWest Bank and GazaWorldYemen, Rep.ZambiaZimbabwe línea de tiempo (timeline):
En esta escala de tiempo se presenta un gráfico de 1973 y 2015 de Cuba. Los datos de 1972 están ausentes. El número de observaciones reales por fecha: 40.
Fuente (nombre):
Indicadores del desarrollo mundial
Fuente (organización):
United Nations Educational, Scientific, and Cultural Organization (UNESCO) Institute for Statistics.
Categorías:
Education, Gender
Se ha actualizado:
23 abr 2017 año
Los indicadores de los cambios de valor en los últimos años
Mínimo:
21.878
1 ene 1973 año
Máximo:
98.045
1 ene 2015 año
A la fecha de observación
Valor
Cambio absoluto
El cambio con respecto al valor anterior
1 ene 1973 año
21.878
+21.878
0.0%
1 ene 1974 año
24.54
+2.663
12.17%
1 ene 1975 año
29.27
+4.729
19.27%
1 ene 1976 año
35.62
+6.35
21.7%
1 ene 1979 año
57.451
+21.831
61.29%
1 ene 1980 año
62.948
+5.497
9.57%
1 ene 1981 año
75.256
+12.308
19.55%
1 ene 1982 año
76.716
+1.46
1.94%
1 ene 1983 año
77.946
+1.23
1.6%
1 ene 1984 año
75.267
-2.678
-3.44%
1 ene 1985 año
79.161
+3.894
5.17%
1 ene 1986 año
79.902
+0.741
0.94%
1 ene 1987 año
80.825
+0.923
1.15%
1 ene 1988 año
82.067
+1.242
1.54%
1 ene 1989 año
82.894
+0.826
1.01%
1 ene 1990 año
84.026
+1.132
1.37%
1 ene 1991 año
83.947
-0.078
-0.09%
1 ene 1992 año
83.516
-0.432
-0.51%
1 ene 1993 año
81.652
-1.863
-2.23%
1 ene 1994 año
79.567
-2.086
-2.55%
1 ene 1995 año
75.03
-4.537
-5.7%
1 ene 1996 año
71.871
-3.159
-4.21%
1 ene 1997 año
78.996
+7.125
9.91%
1 ene 1998 año
76.951
-2.046
-2.59%
1 ene 2000 año
78.665
+1.714
2.23%
1 ene 2001 año
82.129
+3.464
4.4%
1 ene 2002 año
83.77
+1.641
2.0%
1 ene 2003 año
89.856
+6.086
7.27%
1 ene 2004 año
93.011
+3.155
3.51%
1 ene 2005 año
90.515
-2.496
-2.68%
1 ene 2006 año
91.758
+1.243
1.37%
1 ene 2007 año
92.735
+0.976
1.06%
1 ene 2008 año
93.103
+0.368
0.4%
1 ene 2009 año
92.626
-0.476
-0.51%
1 ene 2010 año
90.851
-1.776
-1.92%
1 ene 2011 año
91.299
+0.448
0.49%
1 ene 2012 año
91.745
+0.446
0.49%
1 ene 2013 año
90.565
-1.179
-1.29%
1 ene 2014 año
92.419
+1.854
2.05%
1 ene 2015 año
98.045
+5.626
6.09%
Ranking de los países por los datos estadísticos actuales


Comentarios: