29
/es/
es
AIzaSyAYiBZKx7MnpbEhh9jyipgxe19OcubqV5w
April 1, 2024
100596
Cameroon
CMR
true
2
1
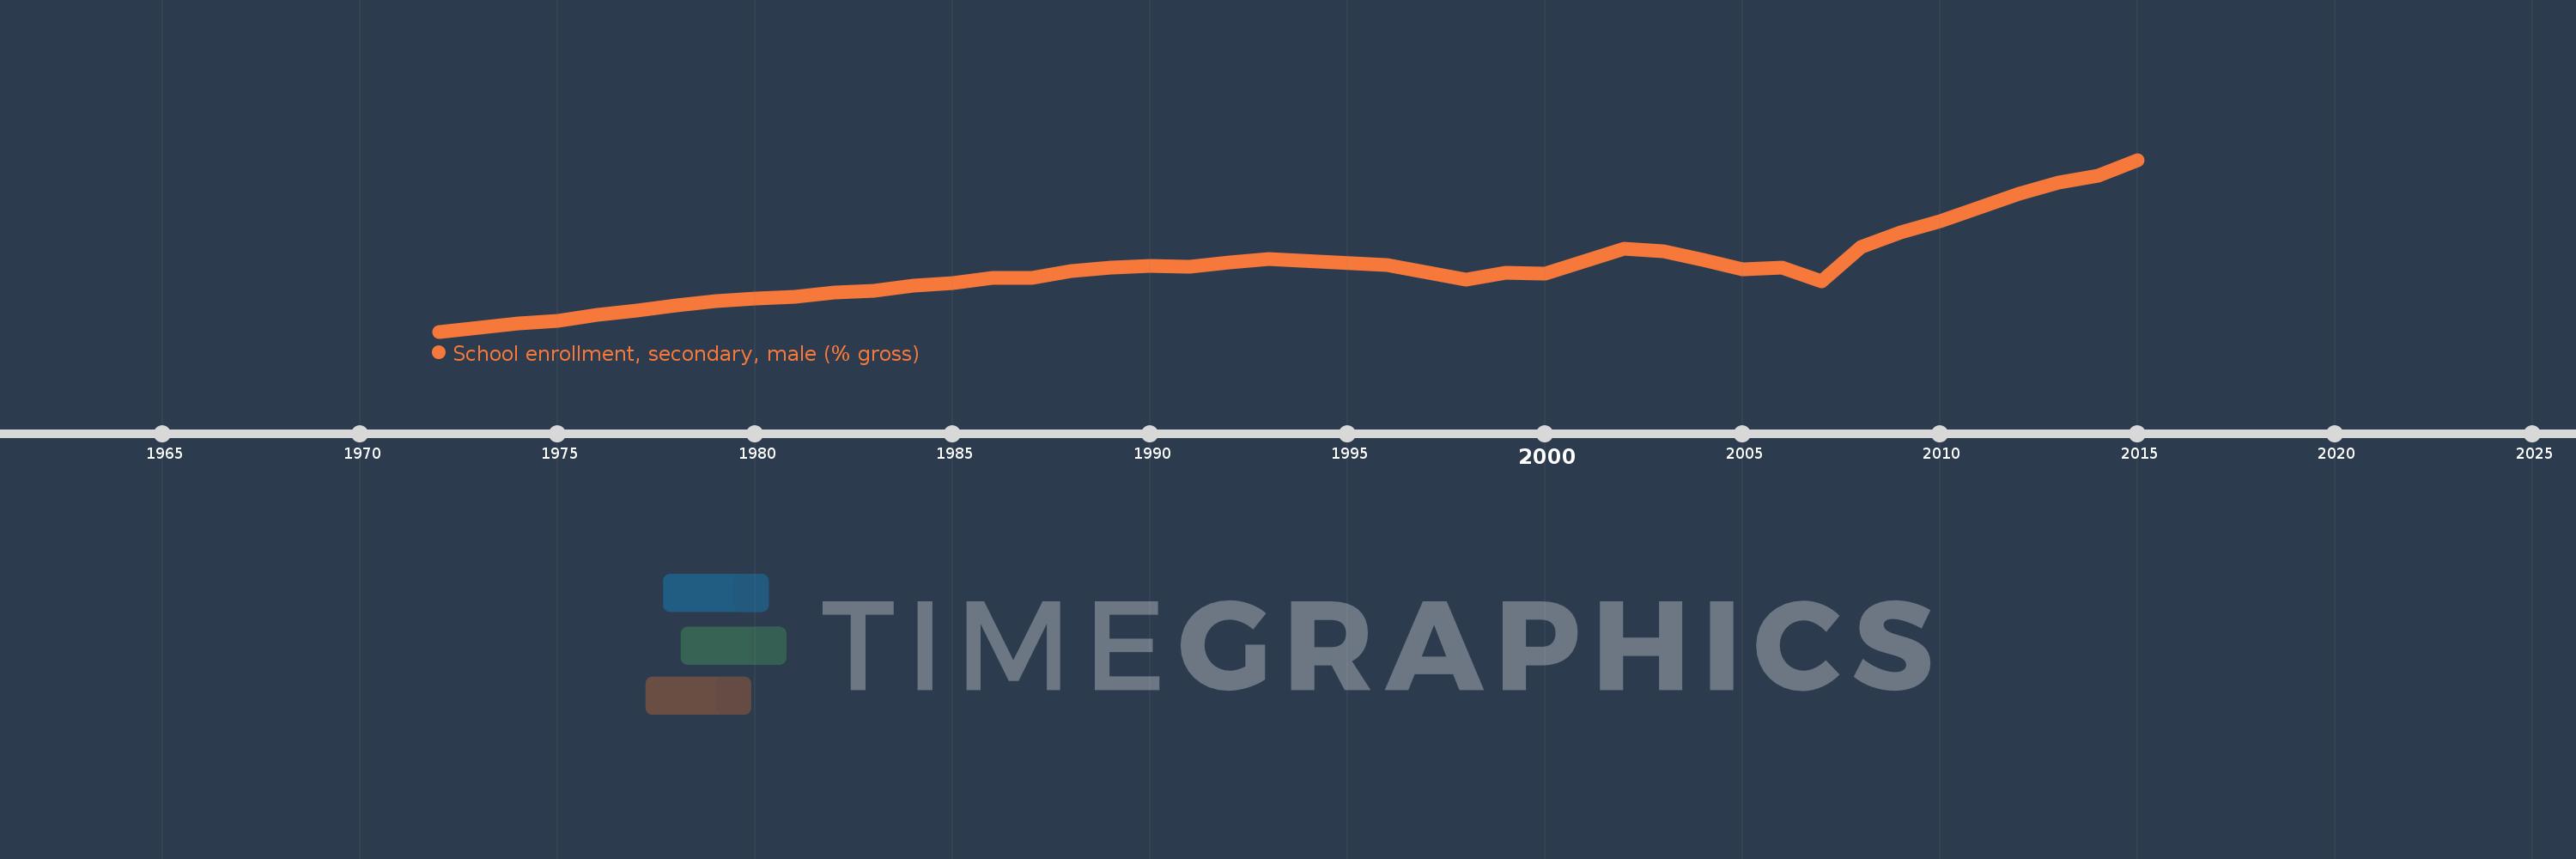
School enrollment, secondary, male (% gross)
2015,2014,2013,2012,2010,2009,2008,2007,2006,2005,2004,2003,2002,2000,1999,1998,1996,1993,1992,1991,1990,1989,1988,1987,1986,1985,1984,1983,1982,1981,1980,1979,1978,1977,1976,1975,1974,1973,1972
Estas estadísticas en otros países:
AfghanistanAlbaniaAlgeriaAndorraAngolaAntigua and BarbudaArab WorldArgentinaArmeniaArubaAustraliaAustriaAzerbaijanBahamas, TheBahrainBangladeshBarbadosBelarusBelgiumBelizeBeninBermudaBhutanBoliviaBosnia and HerzegovinaBotswanaBrazilBrunei DarussalamBulgariaBurkina FasoBurundiCabo VerdeCambodiaCameroonCanadaCaribbean small statesCentral African RepublicCentral Europe and the BalticsChadChileChinaColombiaComorosCongo, Dem. Rep.Congo, Rep.Costa RicaCote d'IvoireCroatiaCubaCuracaoCyprusCzech RepublicDenmarkDjiboutiDominicaDominican RepublicEarly-demographic dividendEast Asia & PacificEast Asia & Pacific (excluding high income)East Asia & Pacific (IDA & IBRD countries)EcuadorEgypt, Arab Rep.El SalvadorEquatorial GuineaEritreaEstoniaEthiopiaEuro areaEurope & Central AsiaEurope & Central Asia (excluding high income)Europe & Central Asia (IDA & IBRD countries)European UnionFijiFinlandFragile and conflict affected situationsFranceGabonGambia, TheGeorgiaGermanyGhanaGreeceGrenadaGuatemalaGuineaGuinea-BissauGuyanaHeavily indebted poor countries (HIPC)High incomeHondurasHong Kong SAR, ChinaHungaryIBRD onlyIcelandIDA & IBRD totalIDA blendIDA onlyIDA totalIndiaIndonesiaIran, Islamic Rep.IraqIrelandIsraelItalyJamaicaJapanJordanKazakhstanKenyaKiribatiKorea, Dem. People’s Rep.Korea, Rep.KuwaitKyrgyz RepublicLao PDRLate-demographic dividendLatin America & Caribbean Latin America & Caribbean (excluding high income)Latin America & the Caribbean (IDA & IBRD countries)LatviaLeast developed countries: UN classificationLebanonLesothoLiberiaLibyaLiechtensteinLithuaniaLow & middle incomeLow incomeLower middle incomeLuxembourgMacao SAR, ChinaMacedonia, FYRMadagascarMalawiMaldivesMaliMaltaMarshall IslandsMauritaniaMauritiusMexicoMicronesia, Fed. Sts.Middle East & North AfricaMiddle East & North Africa (excluding high income)Middle East & North Africa (IDA & IBRD countries)Middle incomeMoldovaMongoliaMontenegroMoroccoMozambiqueMyanmarNamibiaNauruNepalNetherlandsNew ZealandNicaraguaNigerNigeriaNorth AmericaNorwayOECD membersOmanOther small statesPacific island small statesPakistanPalauPanamaPapua New GuineaParaguayPeruPhilippinesPolandPortugalPost-demographic dividendPre-demographic dividendPuerto RicoQatarRomaniaRussian FederationRwandaSamoaSan MarinoSao Tome and PrincipeSaudi ArabiaSenegalSerbiaSeychellesSierra LeoneSlovak RepublicSloveniaSmall statesSolomon IslandsSomaliaSouth AfricaSouth AsiaSouth Asia (IDA & IBRD)SpainSri LankaSt. Kitts and NevisSt. LuciaSt. Vincent and the GrenadinesSub-Saharan Africa Sub-Saharan Africa (excluding high income)Sub-Saharan Africa (IDA & IBRD countries)SudanSurinameSwazilandSwedenSwitzerlandSyrian Arab RepublicTajikistanTanzaniaThailandTimor-LesteTogoTongaTrinidad and TobagoTunisiaTurkeyTurkmenistanTuvaluUgandaUkraineUnited Arab EmiratesUnited KingdomUnited StatesUpper middle incomeUruguayUzbekistanVanuatuVenezuela, RBVietnamWest Bank and GazaWorldYemen, Rep.ZambiaZimbabwe línea de tiempo (timeline):
En esta escala de tiempo se presenta un gráfico de 1972 y 2015 de Cameroon. Los datos de 1971 están ausentes. El número de observaciones reales por fecha: 39.
Fuente (nombre):
Indicadores del desarrollo mundial
Fuente (organización):
United Nations Educational, Scientific, and Cultural Organization (UNESCO) Institute for Statistics.
Categorías:
Education, Gender
Se ha actualizado:
23 abr 2017 año
Los indicadores de los cambios de valor en los últimos años
Mínimo:
11.391
1 ene 1972 año
Máximo:
60.949
1 ene 2015 año
A la fecha de observación
Valor
Cambio absoluto
El cambio con respecto al valor anterior
1 ene 1972 año
11.391
+11.391
0.0%
1 ene 1973 año
12.5
+1.108
9.73%
1 ene 1974 año
13.767
+1.267
10.13%
1 ene 1975 año
14.584
+0.818
5.94%
1 ene 1976 año
16.129
+1.544
10.59%
1 ene 1977 año
17.438
+1.309
8.12%
1 ene 1978 año
18.885
+1.447
8.3%
1 ene 1979 año
20.201
+1.316
6.97%
1 ene 1980 año
20.933
+0.732
3.62%
1 ene 1981 año
21.479
+0.546
2.61%
1 ene 1982 año
22.768
+1.289
6.0%
1 ene 1983 año
23.165
+0.397
1.74%
1 ene 1984 año
24.566
+1.401
6.05%
1 ene 1985 año
25.39
+0.824
3.35%
1 ene 1986 año
26.782
+1.392
5.48%
1 ene 1987 año
26.814
+0.032
0.12%
1 ene 1988 año
28.923
+2.109
7.87%
1 ene 1989 año
29.931
+1.008
3.49%
1 ene 1990 año
30.227
+0.296
0.99%
1 ene 1991 año
30.219
-0.008
-0.03%
1 ene 1992 año
31.431
+1.212
4.01%
1 ene 1993 año
32.408
+0.977
3.11%
1 ene 1996 año
30.511
-1.897
-5.85%
1 ene 1998 año
26.431
-4.08
-13.37%
1 ene 1999 año
28.446
+2.016
7.63%
1 ene 2000 año
28.216
-0.23
-0.81%
1 ene 2002 año
35.382
+7.166
25.4%
1 ene 2003 año
34.498
-0.885
-2.5%
1 ene 2004 año
32.033
-2.465
-7.15%
1 ene 2005 año
29.275
-2.758
-8.61%
1 ene 2006 año
29.782
+0.508
1.73%
1 ene 2007 año
25.854
-3.928
-13.19%
1 ene 2008 año
35.768
+9.914
38.35%
1 ene 2009 año
39.937
+4.169
11.66%
1 ene 2010 año
43.204
+3.267
8.18%
1 ene 2012 año
51.201
+7.997
18.51%
1 ene 2013 año
54.369
+3.167
6.19%
1 ene 2014 año
56.35
+1.981
3.64%
1 ene 2015 año
60.949
+4.599
8.16%
Ranking de los países por los datos estadísticos actuales


Comentarios: