29
/es/
es
AIzaSyAYiBZKx7MnpbEhh9jyipgxe19OcubqV5w
April 1, 2024
55757
Pre-demographic dividend
PRE
false
2
1
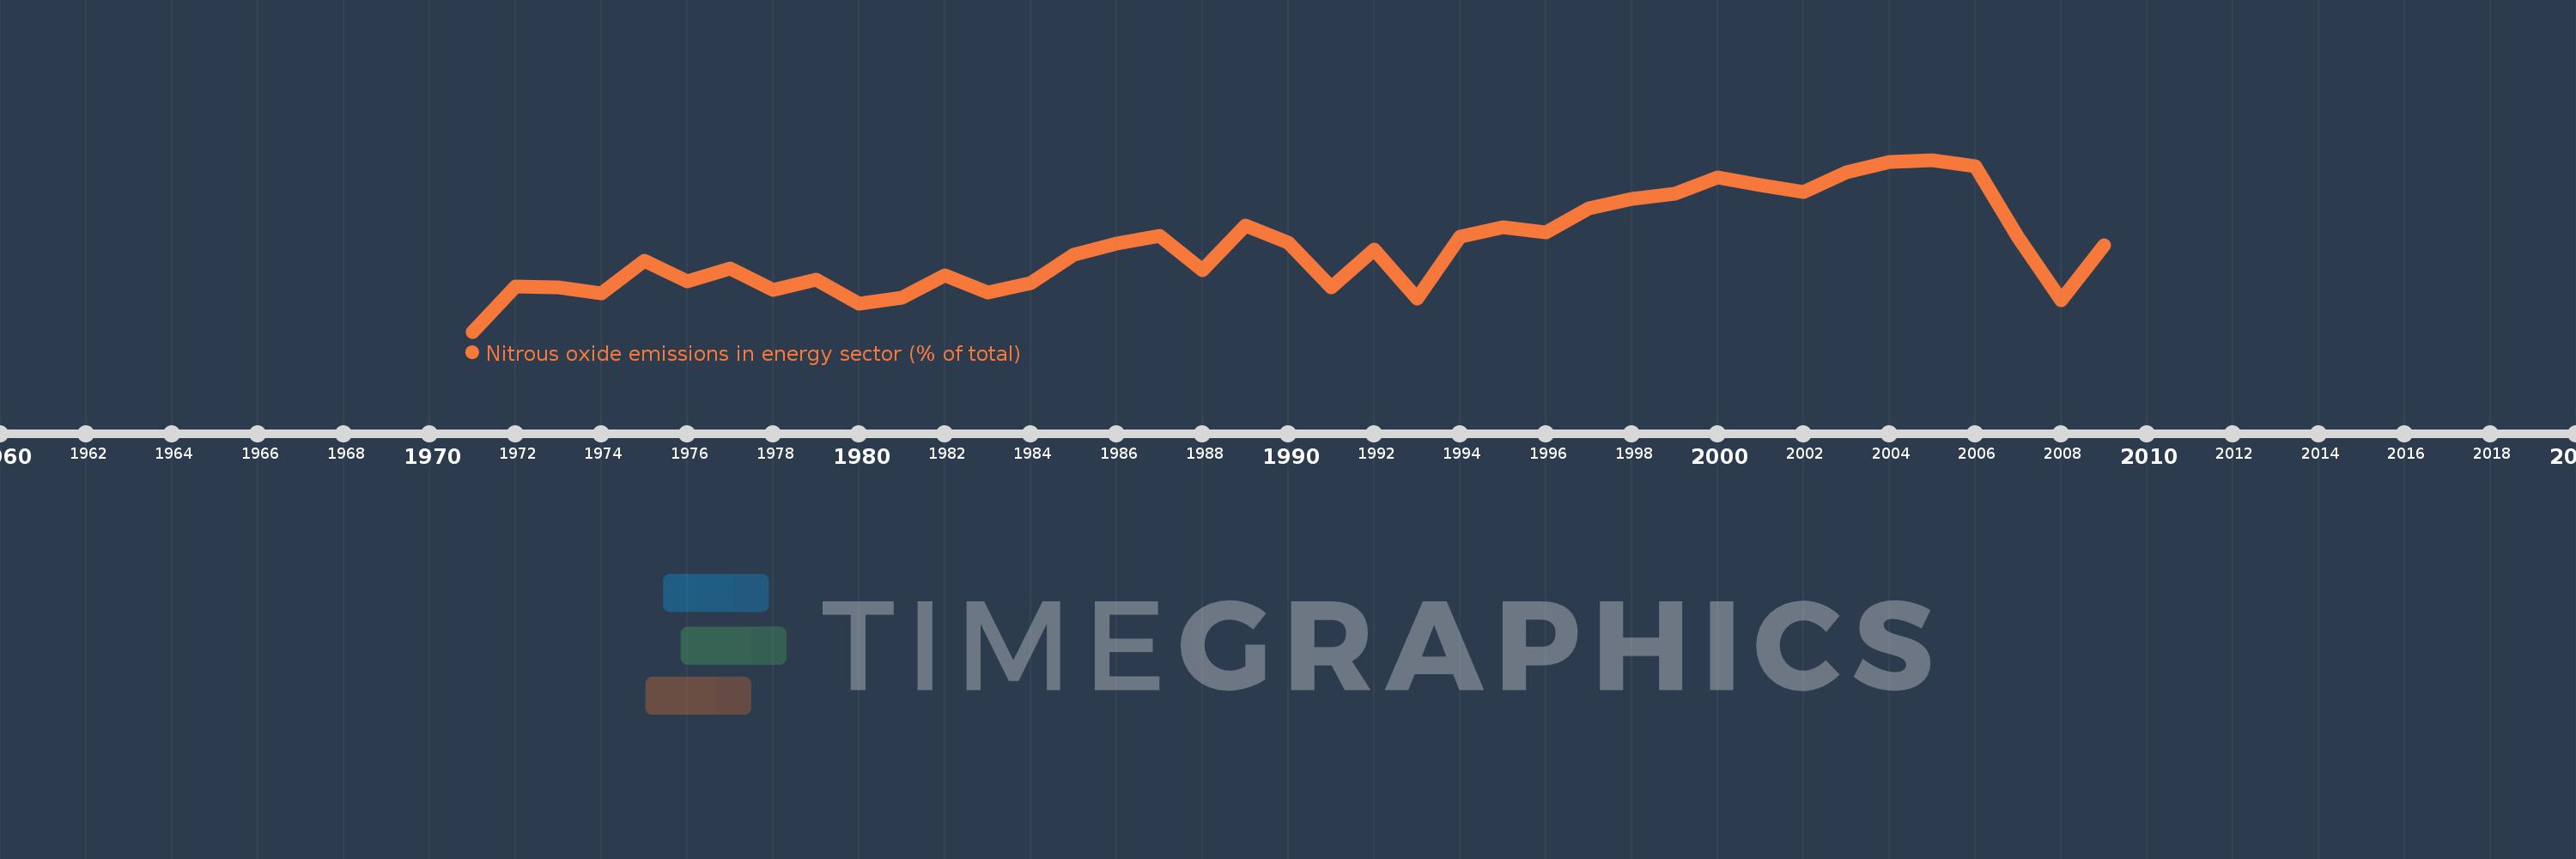
Nitrous oxide emissions in energy sector (% of total)
2009,2008,2007,2006,2005,2004,2003,2002,2001,2000,1999,1998,1997,1996,1995,1994,1993,1992,1991,1990,1989,1988,1987,1986,1985,1984,1983,1982,1981,1980,1979,1978,1977,1976,1975,1974,1973,1972,1971
Estas estadísticas en otros países:
AfghanistanAlbaniaAlgeriaAmerican SamoaAndorraAngolaAntigua and BarbudaArab WorldArgentinaArmeniaArubaAustraliaAustriaAzerbaijanBahamas, TheBahrainBangladeshBarbadosBelarusBelgiumBelizeBeninBermudaBhutanBoliviaBosnia and HerzegovinaBotswanaBrazilBritish Virgin IslandsBrunei DarussalamBulgariaBurkina FasoBurundiCabo VerdeCambodiaCameroonCanadaCaribbean small statesCayman IslandsCentral African RepublicCentral Europe and the BalticsChadChileChinaColombiaComorosCongo, Dem. Rep.Congo, Rep.Costa RicaCote d'IvoireCroatiaCubaCyprusCzech RepublicDenmarkDjiboutiDominicaDominican RepublicEarly-demographic dividendEast Asia & PacificEast Asia & Pacific (excluding high income)East Asia & Pacific (IDA & IBRD countries)EcuadorEgypt, Arab Rep.El SalvadorEquatorial GuineaEritreaEstoniaEthiopiaEuro areaEurope & Central AsiaEurope & Central Asia (excluding high income)Europe & Central Asia (IDA & IBRD countries)European UnionFaroe IslandsFijiFinlandFragile and conflict affected situationsFranceFrench PolynesiaGabonGambia, TheGeorgiaGermanyGhanaGibraltarGreeceGreenlandGrenadaGuamGuatemalaGuineaGuinea-BissauGuyanaHaitiHeavily indebted poor countries (HIPC)High incomeHondurasHong Kong SAR, ChinaHungaryIBRD onlyIcelandIDA & IBRD totalIDA blendIDA onlyIDA totalIndiaIndonesiaIran, Islamic Rep.IraqIrelandIsraelItalyJamaicaJapanJordanKazakhstanKenyaKiribatiKorea, Dem. People’s Rep.Korea, Rep.KuwaitKyrgyz RepublicLao PDRLate-demographic dividendLatin America & Caribbean Latin America & Caribbean (excluding high income)Latin America & the Caribbean (IDA & IBRD countries)LatviaLeast developed countries: UN classificationLebanonLesothoLiberiaLibyaLithuaniaLow & middle incomeLow incomeLower middle incomeLuxembourgMacao SAR, ChinaMacedonia, FYRMadagascarMalawiMalaysiaMaldivesMaliMaltaMarshall IslandsMauritaniaMauritiusMexicoMicronesia, Fed. Sts.Middle East & North AfricaMiddle East & North Africa (excluding high income)Middle East & North Africa (IDA & IBRD countries)Middle incomeMoldovaMongoliaMoroccoMozambiqueMyanmarNamibiaNauruNepalNetherlandsNew CaledoniaNew ZealandNicaraguaNigerNigeriaNorth AmericaNorthern Mariana IslandsNorwayOECD membersOmanOther small statesPacific island small statesPakistanPalauPanamaPapua New GuineaParaguayPeruPhilippinesPolandPortugalPost-demographic dividendPre-demographic dividendPuerto RicoQatarRomaniaRussian FederationRwandaSamoaSao Tome and PrincipeSaudi ArabiaSenegalSerbiaSeychellesSierra LeoneSingaporeSlovak RepublicSloveniaSmall statesSolomon IslandsSomaliaSouth AfricaSouth AsiaSouth Asia (IDA & IBRD)SpainSri LankaSt. Kitts and NevisSt. LuciaSt. Vincent and the GrenadinesSub-Saharan Africa Sub-Saharan Africa (excluding high income)Sub-Saharan Africa (IDA & IBRD countries)SudanSurinameSwazilandSwedenSwitzerlandSyrian Arab RepublicTajikistanTanzaniaThailandTimor-LesteTogoTongaTrinidad and TobagoTunisiaTurkeyTurkmenistanTurks and Caicos IslandsTuvaluUgandaUkraineUnited Arab EmiratesUnited KingdomUnited StatesUpper middle incomeUruguayUzbekistanVanuatuVenezuela, RBVietnamVirgin Islands (U.S.)WorldYemen, Rep.ZambiaZimbabwe línea de tiempo (timeline):
En esta escala de tiempo se presenta un gráfico de 1971 y 2009 de Pre-demographic dividend. Los datos de 1970 están ausentes. El número de observaciones reales por fecha: 39.
Fuente (nombre):
Indicadores del desarrollo mundial
Fuente (organización):
World Bank staff estimates from original source: European Commission, Joint Research Centre (JRC)/Netherlands Environmental Assessment Agency (PBL). Emission Database for Global Atmospheric Research (EDGAR): http://edgar.jrc.ec.europa.eu/.
Categorías:
Energy & Mining, Environment
Se ha actualizado:
23 abr 2017 año
Los indicadores de los cambios de valor en los últimos años
Mínimo:
1.135
1 ene 1971 año
Máximo:
3.201
1 ene 2005 año
A la fecha de observación
Valor
Cambio absoluto
El cambio con respecto al valor anterior
1 ene 1971 año
1.135
+1.135
0.0%
1 ene 1972 año
1.675
+0.54
47.56%
1 ene 1973 año
1.665
-0.01
-0.62%
1 ene 1974 año
1.59
-0.075
-4.5%
1 ene 1975 año
1.992
+0.403
25.32%
1 ene 1976 año
1.737
-0.255
-12.82%
1 ene 1977 año
1.89
+0.153
8.78%
1 ene 1978 año
1.637
-0.253
-13.37%
1 ene 1979 año
1.761
+0.124
7.54%
1 ene 1980 año
1.472
-0.288
-16.38%
1 ene 1981 año
1.542
+0.07
4.77%
1 ene 1982 año
1.81
+0.268
17.37%
1 ene 1983 año
1.608
-0.202
-11.18%
1 ene 1984 año
1.72
+0.112
6.94%
1 ene 1985 año
2.058
+0.338
19.68%
1 ene 1986 año
2.19
+0.132
6.42%
1 ene 1987 año
2.289
+0.099
4.51%
1 ene 1988 año
1.878
-0.411
-17.97%
1 ene 1989 año
2.408
+0.531
28.27%
1 ene 1990 año
2.199
-0.209
-8.68%
1 ene 1991 año
1.665
-0.534
-24.29%
1 ene 1992 año
2.12
+0.454
27.29%
1 ene 1993 año
1.531
-0.588
-27.75%
1 ene 1994 año
2.274
+0.743
48.5%
1 ene 1995 año
2.39
+0.116
5.09%
1 ene 1996 año
2.324
-0.066
-2.75%
1 ene 1997 año
2.62
+0.296
12.72%
1 ene 1998 año
2.735
+0.115
4.4%
1 ene 1999 año
2.796
+0.061
2.21%
1 ene 2000 año
2.993
+0.198
7.07%
1 ene 2001 año
2.898
-0.096
-3.2%
1 ene 2002 año
2.817
-0.08
-2.77%
1 ene 2003 año
3.049
+0.231
8.21%
1 ene 2004 año
3.175
+0.126
4.13%
1 ene 2005 año
3.201
+0.027
0.84%
1 ene 2006 año
3.12
-0.081
-2.54%
1 ene 2007 año
2.263
-0.857
-27.46%
1 ene 2008 año
1.513
-0.75
-33.15%
1 ene 2009 año
2.178
+0.665
43.94%
Ranking de los países por los datos estadísticos actuales


Comentarios: