29
/es/
es
AIzaSyAYiBZKx7MnpbEhh9jyipgxe19OcubqV5w
April 1, 2024
41770
Latin America & Caribbean
LCN
false
2
1
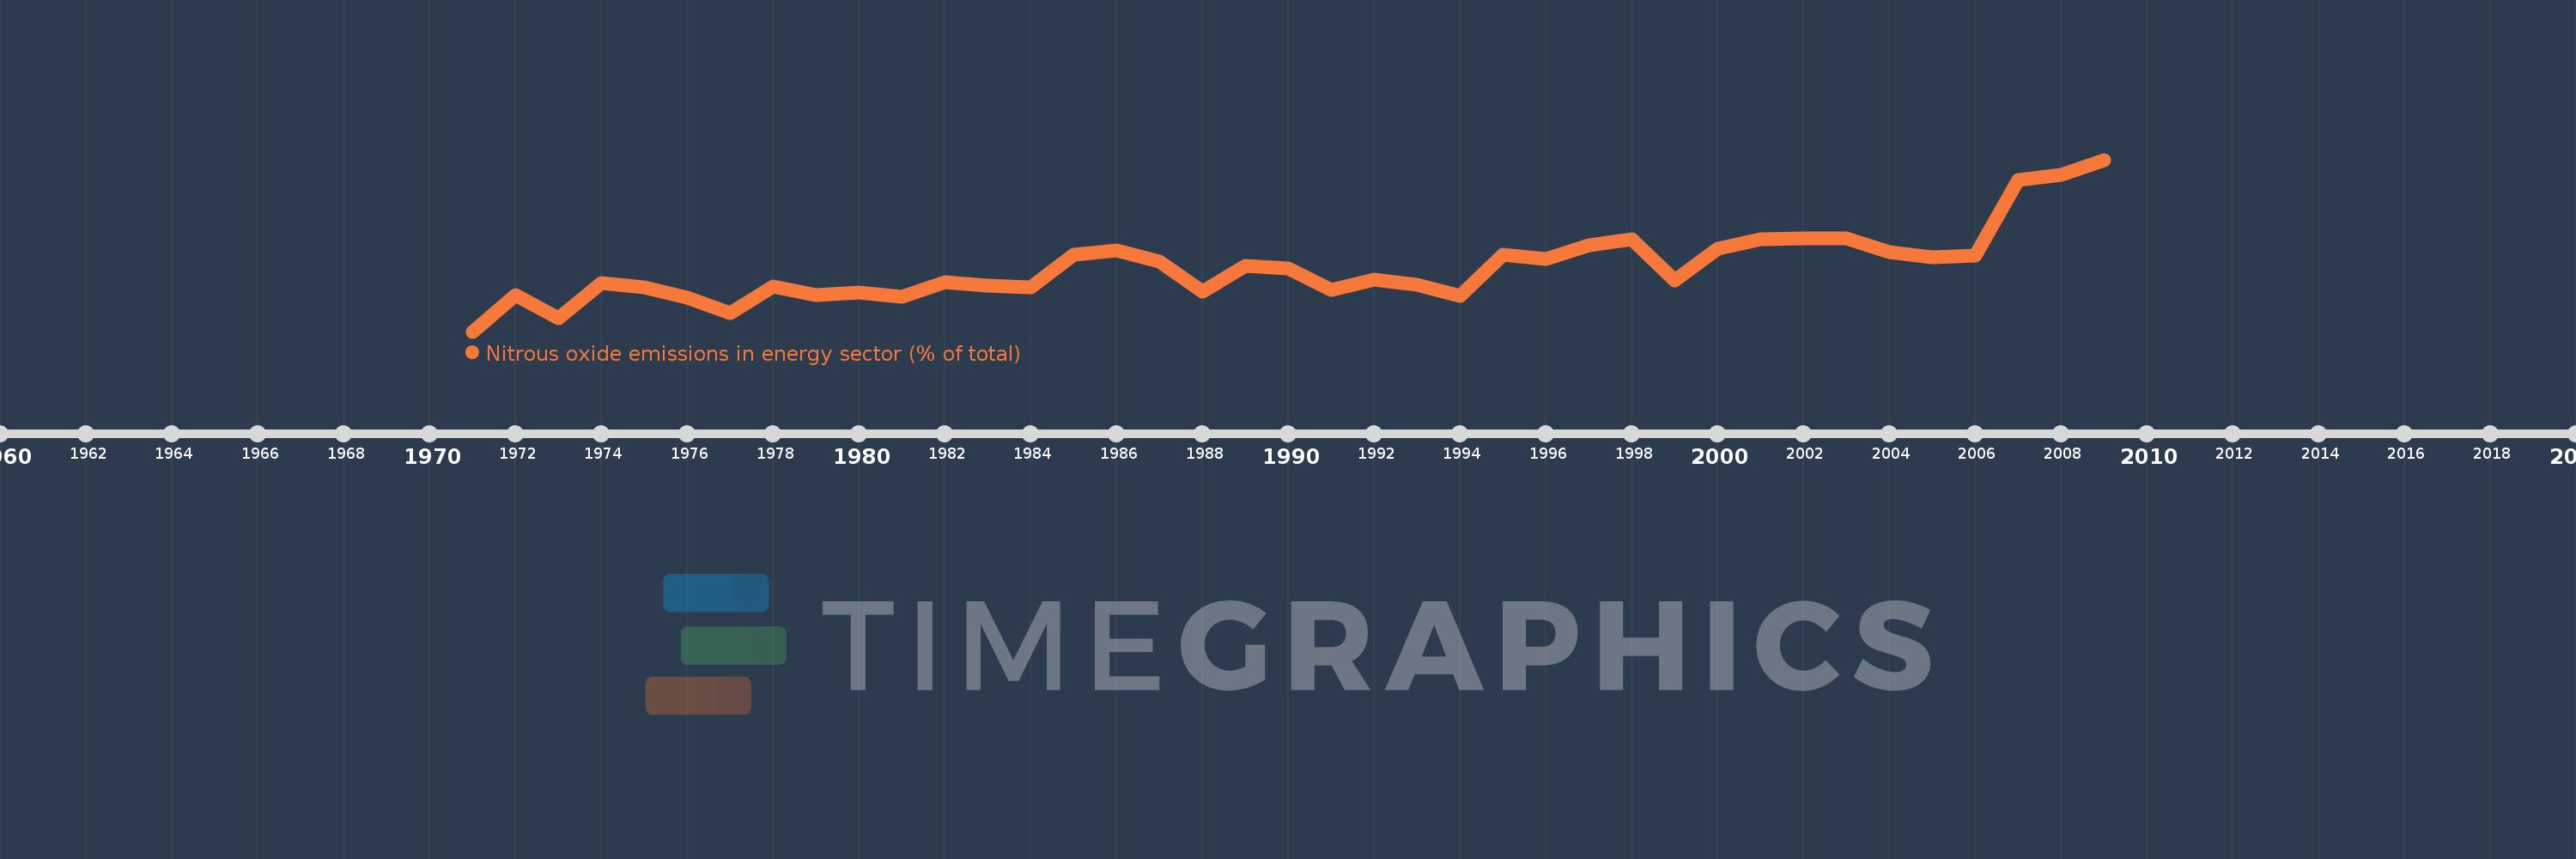
Nitrous oxide emissions in energy sector (% of total)
2009,2008,2007,2006,2005,2004,2003,2002,2001,2000,1999,1998,1997,1996,1995,1994,1993,1992,1991,1990,1989,1988,1987,1986,1985,1984,1983,1982,1981,1980,1979,1978,1977,1976,1975,1974,1973,1972,1971
Estas estadísticas en otros países:
AfghanistanAlbaniaAlgeriaAmerican SamoaAndorraAngolaAntigua and BarbudaArab WorldArgentinaArmeniaArubaAustraliaAustriaAzerbaijanBahamas, TheBahrainBangladeshBarbadosBelarusBelgiumBelizeBeninBermudaBhutanBoliviaBosnia and HerzegovinaBotswanaBrazilBritish Virgin IslandsBrunei DarussalamBulgariaBurkina FasoBurundiCabo VerdeCambodiaCameroonCanadaCaribbean small statesCayman IslandsCentral African RepublicCentral Europe and the BalticsChadChileChinaColombiaComorosCongo, Dem. Rep.Congo, Rep.Costa RicaCote d'IvoireCroatiaCubaCyprusCzech RepublicDenmarkDjiboutiDominicaDominican RepublicEarly-demographic dividendEast Asia & PacificEast Asia & Pacific (excluding high income)East Asia & Pacific (IDA & IBRD countries)EcuadorEgypt, Arab Rep.El SalvadorEquatorial GuineaEritreaEstoniaEthiopiaEuro areaEurope & Central AsiaEurope & Central Asia (excluding high income)Europe & Central Asia (IDA & IBRD countries)European UnionFaroe IslandsFijiFinlandFragile and conflict affected situationsFranceFrench PolynesiaGabonGambia, TheGeorgiaGermanyGhanaGibraltarGreeceGreenlandGrenadaGuamGuatemalaGuineaGuinea-BissauGuyanaHaitiHeavily indebted poor countries (HIPC)High incomeHondurasHong Kong SAR, ChinaHungaryIBRD onlyIcelandIDA & IBRD totalIDA blendIDA onlyIDA totalIndiaIndonesiaIran, Islamic Rep.IraqIrelandIsraelItalyJamaicaJapanJordanKazakhstanKenyaKiribatiKorea, Dem. People’s Rep.Korea, Rep.KuwaitKyrgyz RepublicLao PDRLate-demographic dividendLatin America & Caribbean Latin America & Caribbean (excluding high income)Latin America & the Caribbean (IDA & IBRD countries)LatviaLeast developed countries: UN classificationLebanonLesothoLiberiaLibyaLithuaniaLow & middle incomeLow incomeLower middle incomeLuxembourgMacao SAR, ChinaMacedonia, FYRMadagascarMalawiMalaysiaMaldivesMaliMaltaMarshall IslandsMauritaniaMauritiusMexicoMicronesia, Fed. Sts.Middle East & North AfricaMiddle East & North Africa (excluding high income)Middle East & North Africa (IDA & IBRD countries)Middle incomeMoldovaMongoliaMoroccoMozambiqueMyanmarNamibiaNauruNepalNetherlandsNew CaledoniaNew ZealandNicaraguaNigerNigeriaNorth AmericaNorthern Mariana IslandsNorwayOECD membersOmanOther small statesPacific island small statesPakistanPalauPanamaPapua New GuineaParaguayPeruPhilippinesPolandPortugalPost-demographic dividendPre-demographic dividendPuerto RicoQatarRomaniaRussian FederationRwandaSamoaSao Tome and PrincipeSaudi ArabiaSenegalSerbiaSeychellesSierra LeoneSingaporeSlovak RepublicSloveniaSmall statesSolomon IslandsSomaliaSouth AfricaSouth AsiaSouth Asia (IDA & IBRD)SpainSri LankaSt. Kitts and NevisSt. LuciaSt. Vincent and the GrenadinesSub-Saharan Africa Sub-Saharan Africa (excluding high income)Sub-Saharan Africa (IDA & IBRD countries)SudanSurinameSwazilandSwedenSwitzerlandSyrian Arab RepublicTajikistanTanzaniaThailandTimor-LesteTogoTongaTrinidad and TobagoTunisiaTurkeyTurkmenistanTurks and Caicos IslandsTuvaluUgandaUkraineUnited Arab EmiratesUnited KingdomUnited StatesUpper middle incomeUruguayUzbekistanVanuatuVenezuela, RBVietnamVirgin Islands (U.S.)WorldYemen, Rep.ZambiaZimbabwe línea de tiempo (timeline):
En esta escala de tiempo se presenta un gráfico de 1971 y 2009 de Latin America & Caribbean . Los datos de 1970 están ausentes. El número de observaciones reales por fecha: 39.
Fuente (nombre):
Indicadores del desarrollo mundial
Fuente (organización):
World Bank staff estimates from original source: European Commission, Joint Research Centre (JRC)/Netherlands Environmental Assessment Agency (PBL). Emission Database for Global Atmospheric Research (EDGAR): http://edgar.jrc.ec.europa.eu/.
Categorías:
Energy & Mining, Environment
Se ha actualizado:
23 abr 2017 año
Los indicadores de los cambios de valor en los últimos años
Mínimo:
2.69
1 ene 1971 año
Máximo:
4.171
1 ene 2009 año
A la fecha de observación
Valor
Cambio absoluto
El cambio con respecto al valor anterior
1 ene 1971 año
2.69
+2.69
0.0%
1 ene 1972 año
3.008
+0.319
11.85%
1 ene 1973 año
2.805
-0.203
-6.75%
1 ene 1974 año
3.108
+0.303
10.81%
1 ene 1975 año
3.07
-0.039
-1.25%
1 ene 1976 año
2.98
-0.089
-2.91%
1 ene 1977 año
2.851
-0.13
-4.35%
1 ene 1978 año
3.08
+0.23
8.06%
1 ene 1979 año
3.008
-0.073
-2.36%
1 ene 1980 año
3.029
+0.021
0.7%
1 ene 1981 año
2.992
-0.037
-1.22%
1 ene 1982 año
3.114
+0.122
4.08%
1 ene 1983 año
3.086
-0.028
-0.89%
1 ene 1984 año
3.074
-0.012
-0.4%
1 ene 1985 año
3.351
+0.278
9.03%
1 ene 1986 año
3.389
+0.037
1.12%
1 ene 1987 año
3.294
-0.095
-2.79%
1 ene 1988 año
3.032
-0.262
-7.95%
1 ene 1989 año
3.26
+0.228
7.51%
1 ene 1990 año
3.236
-0.024
-0.75%
1 ene 1991 año
3.048
-0.188
-5.8%
1 ene 1992 año
3.135
+0.086
2.84%
1 ene 1993 año
3.096
-0.039
-1.23%
1 ene 1994 año
2.999
-0.098
-3.15%
1 ene 1995 año
3.35
+0.351
11.7%
1 ene 1996 año
3.318
-0.032
-0.95%
1 ene 1997 año
3.433
+0.115
3.48%
1 ene 1998 año
3.488
+0.055
1.59%
1 ene 1999 año
3.127
-0.361
-10.34%
1 ene 2000 año
3.401
+0.274
8.75%
1 ene 2001 año
3.483
+0.082
2.41%
1 ene 2002 año
3.494
+0.011
0.31%
1 ene 2003 año
3.497
+0.004
0.1%
1 ene 2004 año
3.375
-0.123
-3.51%
1 ene 2005 año
3.329
-0.046
-1.36%
1 ene 2006 año
3.348
+0.019
0.57%
1 ene 2007 año
3.996
+0.648
19.36%
1 ene 2008 año
4.041
+0.045
1.11%
1 ene 2009 año
4.171
+0.13
3.21%
Ranking de los países por los datos estadísticos actuales


Comentarios: